. 2021 Oct 6;3(1):44–55. doi: 10.1039/d1cb00135c

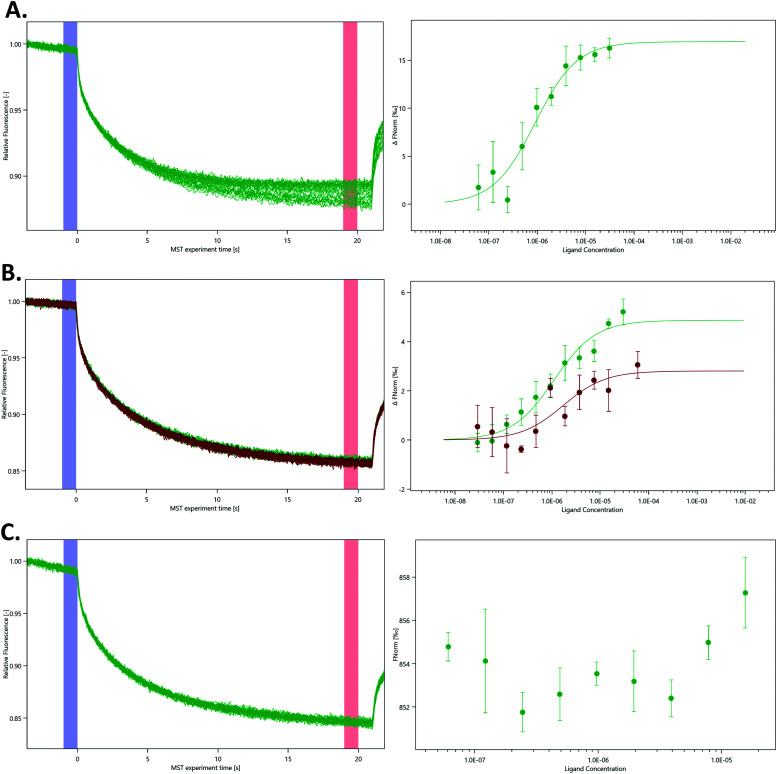
Fig. 4. Quantification of the interaction between various nsp14 domains and nsp10 using MST. MST traces (left panels) show changes in fluorescence upon activation and deactivation of the IR laser. Dose–response curves (right panels) display changes in the ratio between the fluorescence after 5 s MST on time and the fluorescence before the activation of the IR laser under different nsp10 concentrations. (A) N-Terminal ExoN domain, (B) full-length nsp14 in the absence (green) and presence of 3% deuterated DMSO (red) and (C) the C-terminal N7-MTase domain with nsp10. As there was no binding event between the N7-MTase domain and nsp10, the Fnorm figure is presented as provided by the MO. Affinity Analysis software. All experiments were conducted at least in triplicate.

Fig. 4