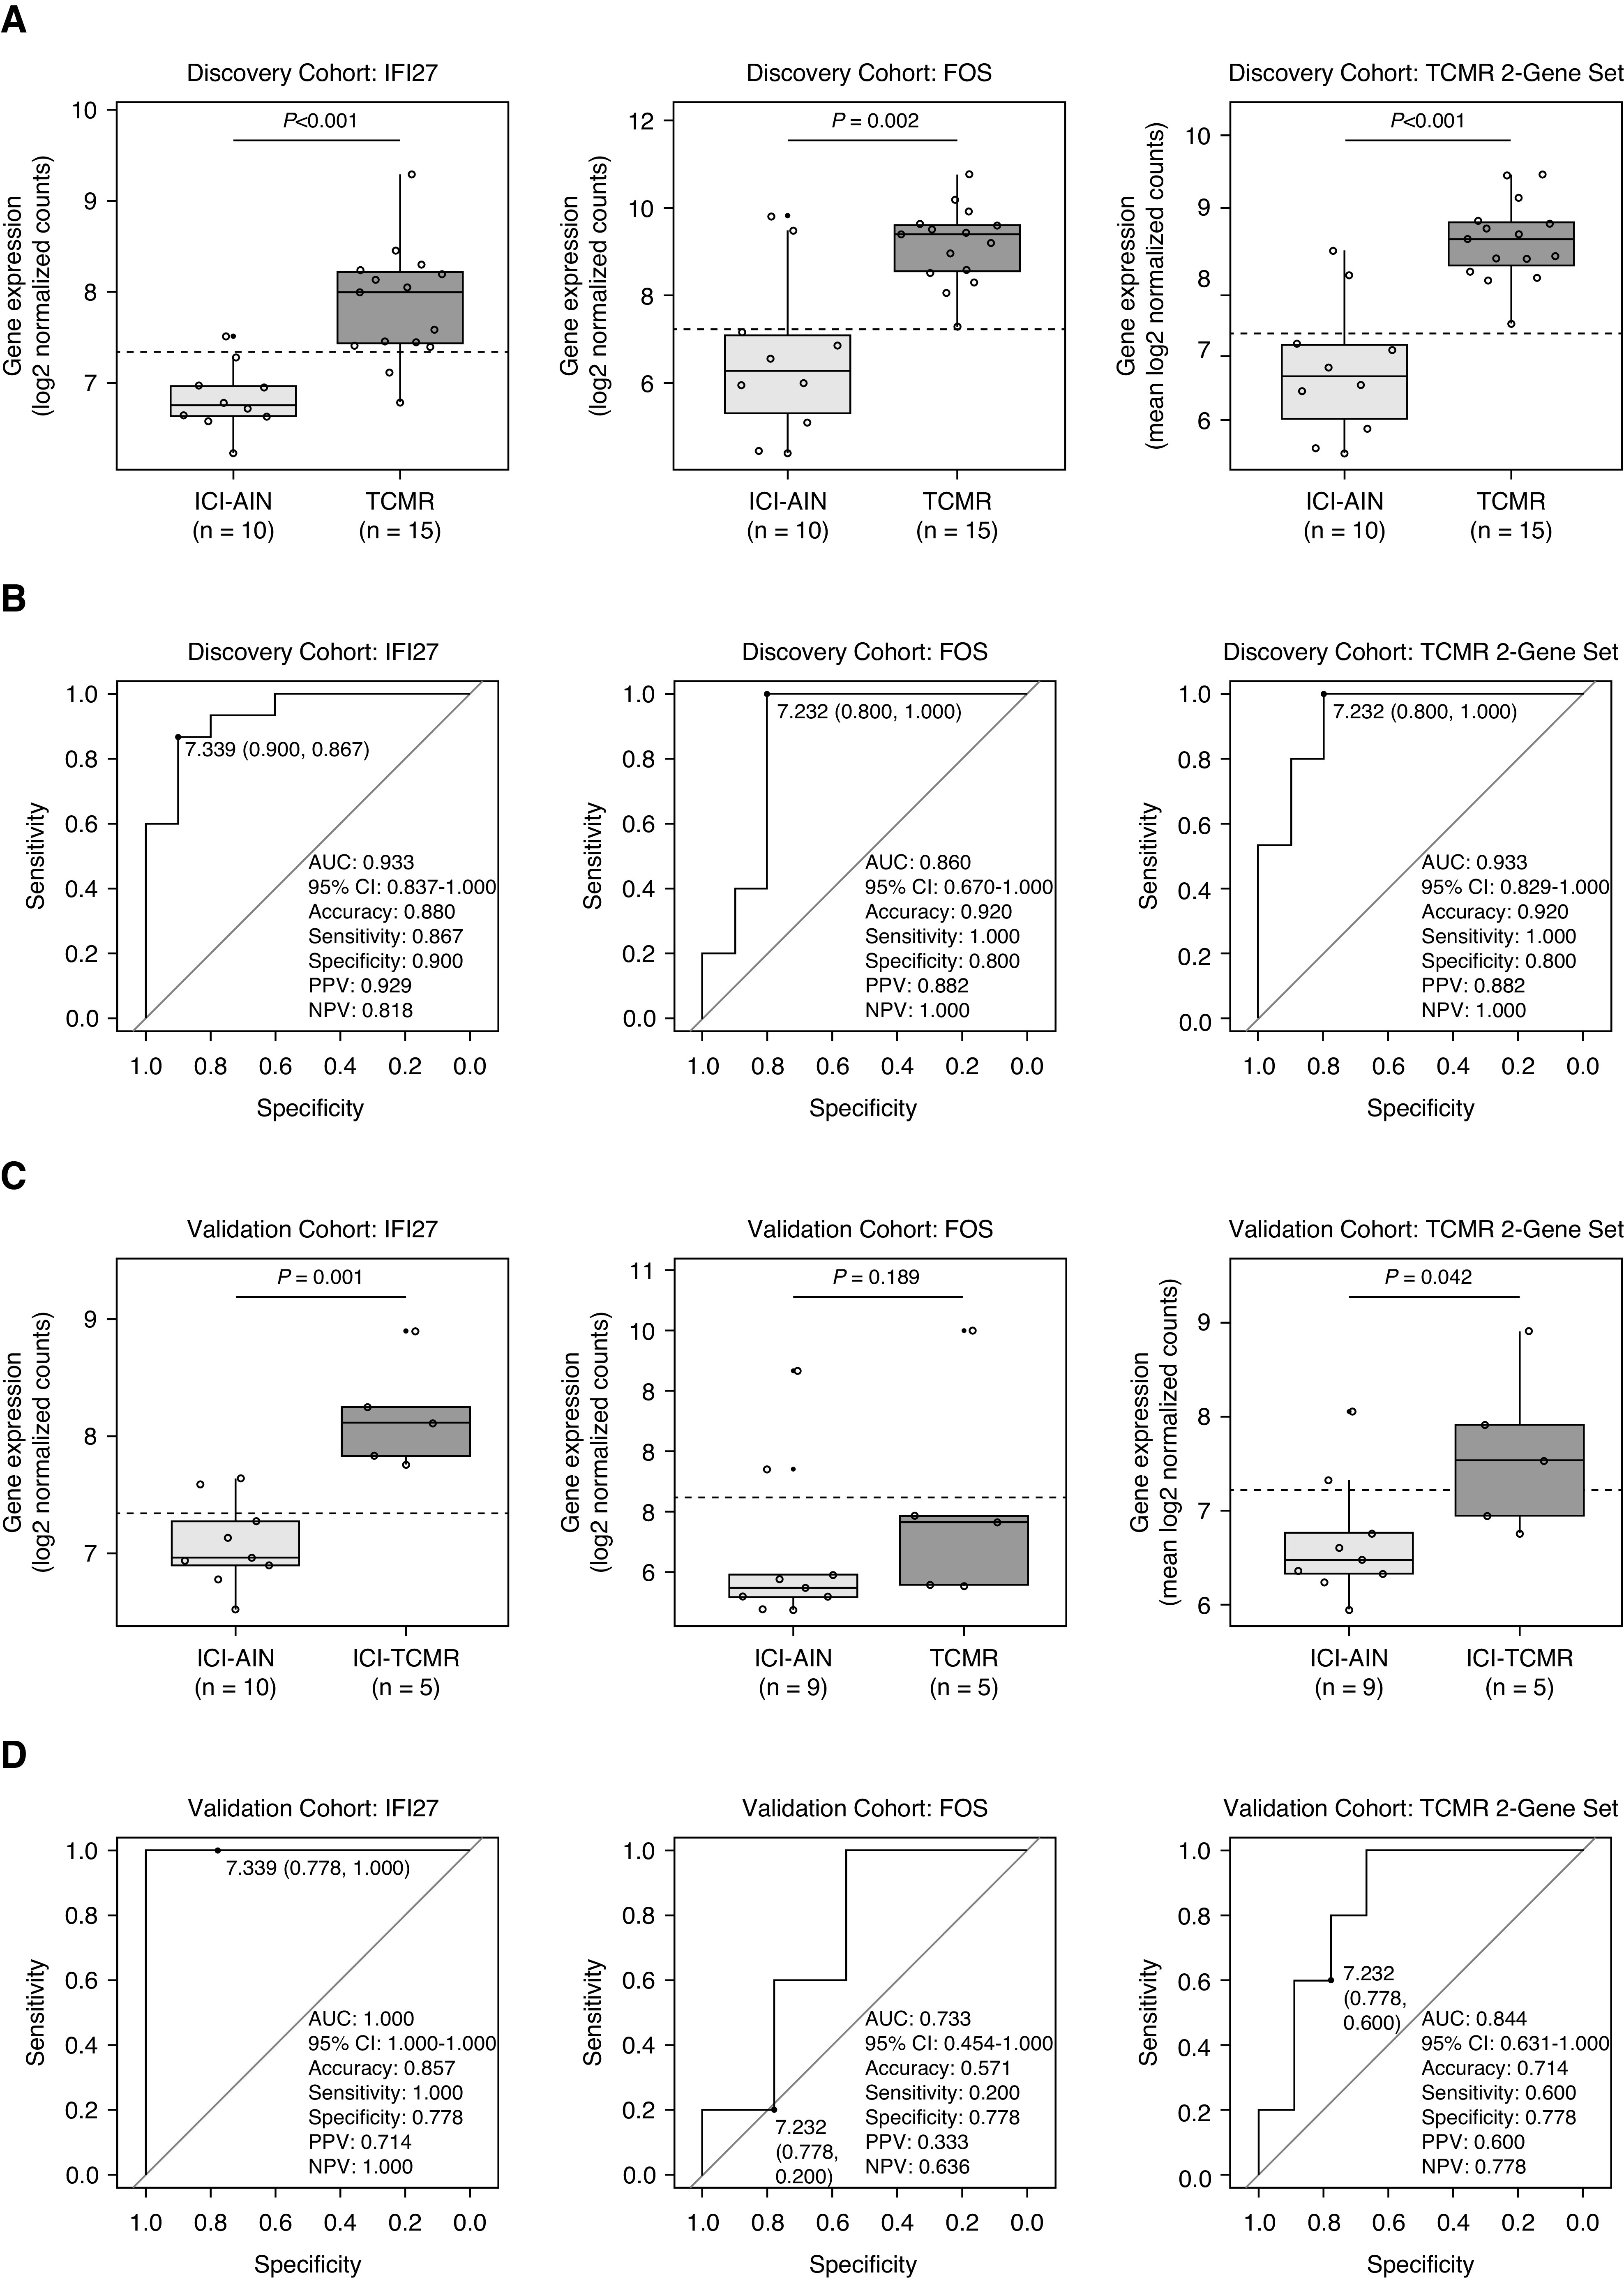
Figure 3.

Diagnostic performance of IFI27 and FOS gene expression in the discovery and validation cohorts. (A) Discovery cohort box plots and (B) receiver operating characteristic (ROC) curves demonstrate excellent discrimination between TCMR and ICI-AIN with IFI27, FOS, and average two-gene set expression (accuracy 88%–92%). Diagnostic thresholds derived from the discovery cohort were then assessed in a separate validation cohort comprising immune checkpoint inhibitor–associated T cell–mediated rejection (ICI-TCMR) and ICI-AIN. (C) Validation cohort box plots and (D) ROC curves reveal similarly excellent diagnostic performance with IFI27 (accuracy 86%) but suboptimal performance with FOS (accuracy 57%). AUC, area under the receiver operating characteristic curve; 95% CI, 95% confidence interval; NPV, negative predictive value: PPV, positive predictive value.
