FIG 2.
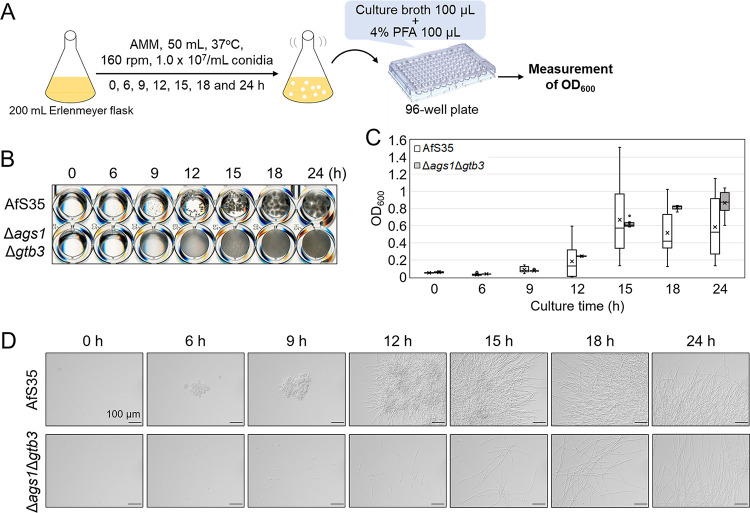
Evaluation of growth of the AfS35 and Δags1Δgtb3 strains by optical density. (A) Scheme of the experiment. Conidia were inoculated into AMM liquid medium, and aliquots were withdrawn at the indicated time points. The culture broth was mixed with 4% paraformaldehyde (PFA) in a 96-well plate, and the optical density at 600 nm (OD600) values were measured with a microplate reader. (B) Growth of the AfS35 and Δags1Δgtb3 strains. (C) Time course of OD600. The OD600 values were calculated from 12 measurements per time point and are shown as box plots. The lines in the boxes indicate medians, and the crosses indicate averages. The circles indicate outliers. (D) Time course of hyphal morphology of the AfS35 and Δags1Δgtb3 strains.

