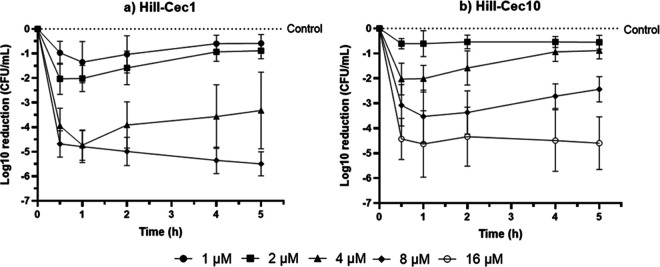
FIG 3.
Time-to-kill curves showing the log10 reductions in P. aeruginosa ATCC 9027 caused by the selected cecropins. (a) Killing kinetics of Hill-Cec1 at 1 μM, 2 μM, 4 μM, and 8 μM. (b) Killing kinetics of Hill-Cec10 at 2 μM, 4 μM, 8 μM, and 16 μM. Graphs represent the mean of five independent experiments.

