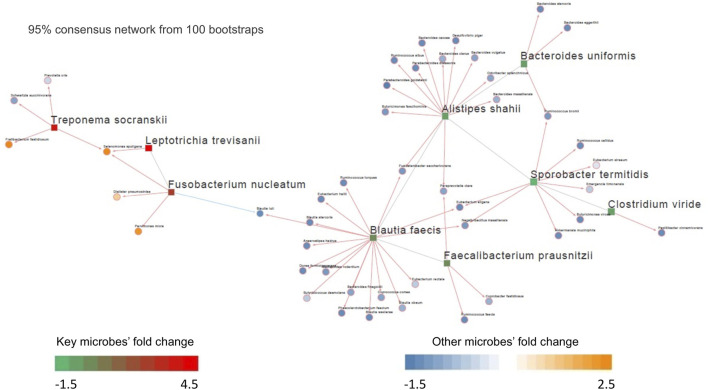
FIGURE 3.
Differential microbial interaction networks in the Kostic cohort. A directed graph displaying differential microbial species between tumor and normal groups (hub microbes) in the Kostic cohort (shown in rectangles; green: depleted in tumor, red: enriched in tumor). Microbes predicted to interacting with the hub microbes were shown based on their differential level between tumor and normal groups (shown in circles; blue: depleted in tumor, orange: enriched in tumor). The connections among microbes were depicted in red (induction) or blue (repression) based on the associations of the hub microbes and their related microbes.

