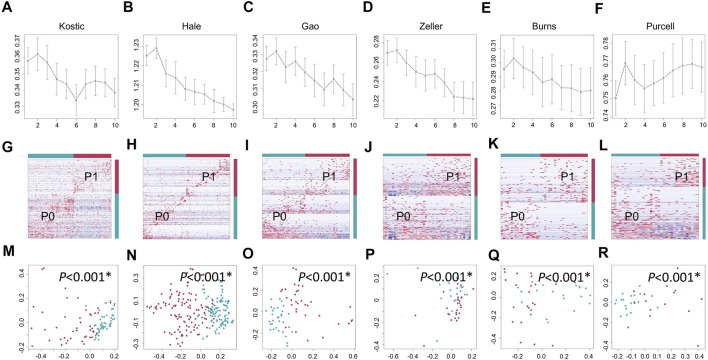
FIGURE 5.
Biclustering identified two microbial subtypes in CRC. Gap statistics (and their standard deviations) per cluster number (1–10), which reach peaks at k = 2 for Kostic (A), Hale (B), Gao (C), Zeller (D), Burns (E), and Purcell (F). Species level abundance heatmaps display biclustering results for Kostic (G), Hale (H), Gao (I), Zeller (J), Burns (K), and Purcell (L). Two patient-microbe interaction patterns (P0 and P1) were consistently identified across the CRC cohorts investigated. Red represents the P1 group, and blue for the P0 group. Each row represents the abundance for each species, with the species’ grouping information indicated by the colored bar located on the right. Each column represents the abundance for each patient, with the patient subtyping information indicated by the colored bar located on the top. The PCoA based on Bray-Curtis dissimilarity was used to estimate the beta diversity of microbial communities for Kostic (M), Hale (N), Gao (O), Zeller (P), Burns (Q), and Purcell (R). Each point represents a patient. P1 patients were in red, and P0 patients in blue. PERMANOVA was used to test for differences between P1 and P0. p-values of 0.05 or lower were considered to be statistically significant, and marked with star.

