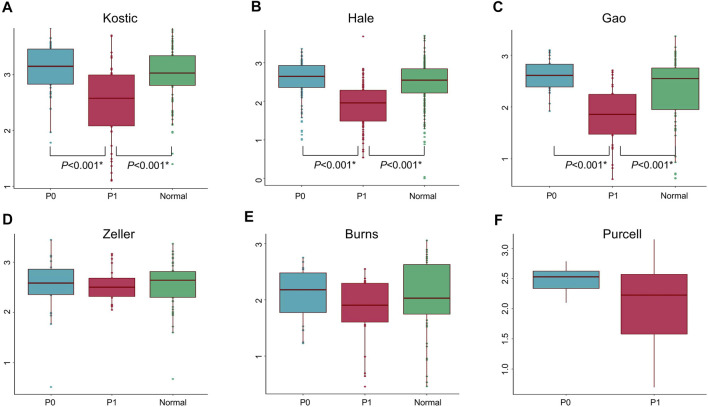
FIGURE 6.
Microbial alpha diversity comparisons in different groups and cohorts. Shannon’s diversity index (in y-axis) was used to measure alpha diversity for Kostic (A), Hale (B), Gao (C), Zeller (D), Burns (E), and Purcell (F). P0 groups were colored blue, P1 were colored red, and Normal were colored green. Alpha diversity differences between groups were evaluated using the pairwise Wilcoxon rank sum tests with Benjamini-Hochberg (BH) correction. Only statistically significant p-values (less than 0.05) were shown below the boxplots, and marked with star.

