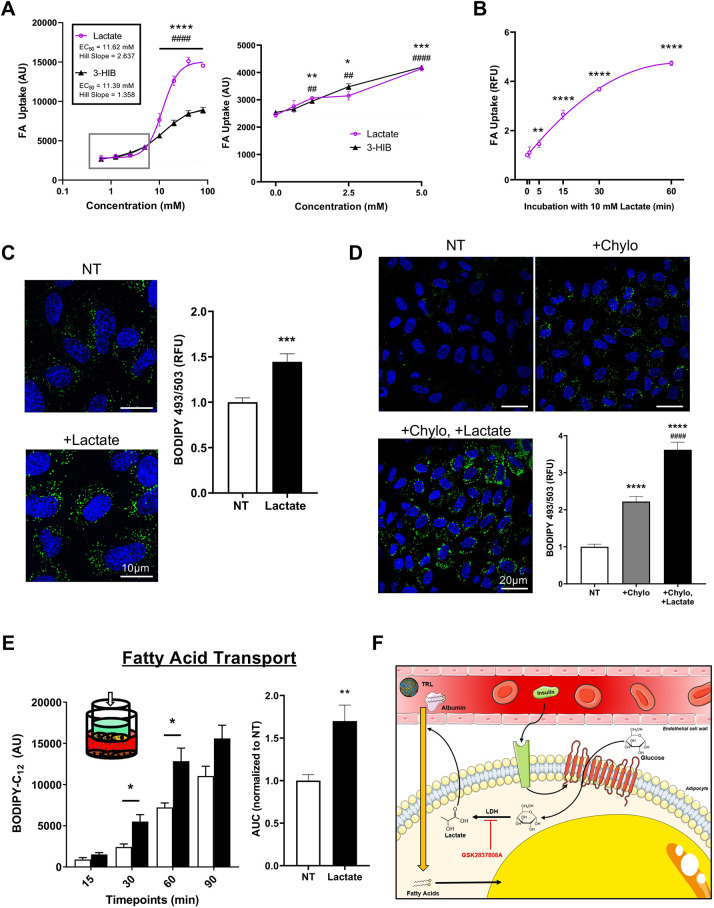
Fig. 4.
Lactate alone is sufficient to increase endothelial FA uptake. (A) Dose-dependent induction of EC FA uptake by lactate or 3-HIB. The dotted lines indicate the curves fit as four-parameter nonlinear models with variable slope, where one curve was fit for responses to lactate and another for responses to 3-HIB. An enlarged view of the boxed region is shown in the right hand graph. n= 3 biological replicates. (B) EC FA uptake after exposure to 10 mM lactate for the indicated time. n=3 biological replicates. (C) Left: representative images of ECs treated for 6 h with 100 µM oleic acid in the presence (+Lactate) or absence (NT) of 10 mM lactate (blue, DAPI staining; green, BODIPY 493/503, marking lipid droplets). Right: quantification of BODIPY signal. n=4 biological replicates, for each of which three different fields of view were imaged. (D) ECs were serum-starved for 2 h before being treated with 10 U/ml LPL for 1 h either without additions (NT), with 25 µg/ml chylomicrons (+Chylo) or with 25 µg/ml chylomicrons and 10 mM lactate (+Chylo +Lactate). Blue, DAPI; green, BODIPY 493/503. Bottom right: quantification of BODIPY signal. n=4 biological replicates, for each of which five different fields of view were imaged. (E) Inset: schematic of the Transwell assay, indicating confluent monolayer of bEnd.3 endothelial cells (yellow), preadipocytes in the bottom chamber (brown), and BODIPY-C12 (green) added to the top chamber. Left: transport of BODIPY-C12 across the endothelial barrier was measured by sampling the bottom chamber at the indicated timepoints. White bars, no lactate (NT); black bars, 10 mM lactate. Right: area under the curve (AUC) quantification. n=6 biological replicates. (F) Diagram summarizing experiment results and model for insulin-stimulated endothelial transport of bloodborne fatty acids from the capillary lumen to the underlying adipocytes. (TRL, triglyceride-rich lipoprotein). Data in A–E are mean±s.e.m. Each experiment was replicated at least twice. *P<0.05, **P<0.01, ***P<0.001, ****P<0.0001 (compared to no treatment); ##P<0.01, ####P<0.0001 (compared to no treatment in A, and to +Chylo in E). Statistics were by one-way ANOVA with Dunnett's test for multiple comparisons. AU, arbitrary units; RFU, relative fluorescence units. Scale bars: 10 µm (C) and 20 µm (D).

