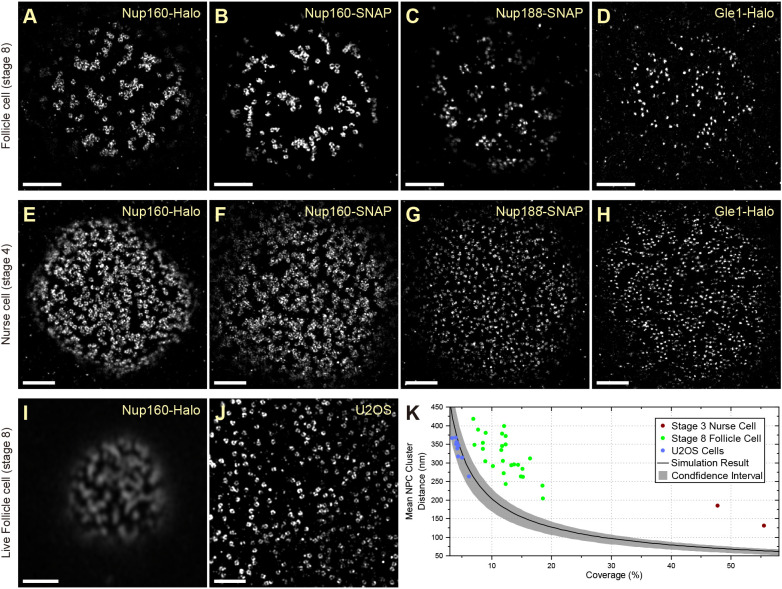
Fig. 5.
Super-resolution imaging in tissue reveals a nonrandom distribution of NPCs. (A–D) DNA-PAINT images of Nup160–Halo (A), Nup160–SNAP (B), Nup188–SNAP (C) and Gle1–Halo (D) in NPC in stage 8 follicle cell nuclei. The NPC appear clustered, regardless of the protein/tag combination used, showing that the organization is not caused by the tag. (E–H) DNA-PAINT images of Nup160–Halo (E), Nup160–SNAP (F), Nup188-SNAP (G) and Gle1–Halo (H) in NPCs of stage 4 nurse cell nuclei. A similar NPC clustering is seen in nurse cell nuclei, suggesting that this organization is not specific to the follicular epithelium. (I) Live imaging of JF646-labelled Nup160–Halo in a stage 8 follicle cell nucleus using a Zeiss Airyscan microscope. The clustering is present in vivo, indicating that it is not caused by fixation. (J) DNA-PAINT image of Nup96–Halo in a cultured U2OS cell nucleus. The NPCs appear uniformly distributed without any underlying organization. (K) A graph showing the mean NPC cluster distance as a function of the proportion of the nuclear envelope covered by NPCs (coverage). The black line shows the mean distances obtained from simulations of random NPC distributions, with 95% confidence intervals shown in grey. U2OS cells show a random distribution of NPCs, whereas the mean distances between NPC clusters are significantly larger in follicle cell and nurse cell nuclei, indicating that the NPCs are non-randomly distributed. See Materials and Methods for analysis details. Scale bars: 1 µm (A–H,J); 5 µm (I).

