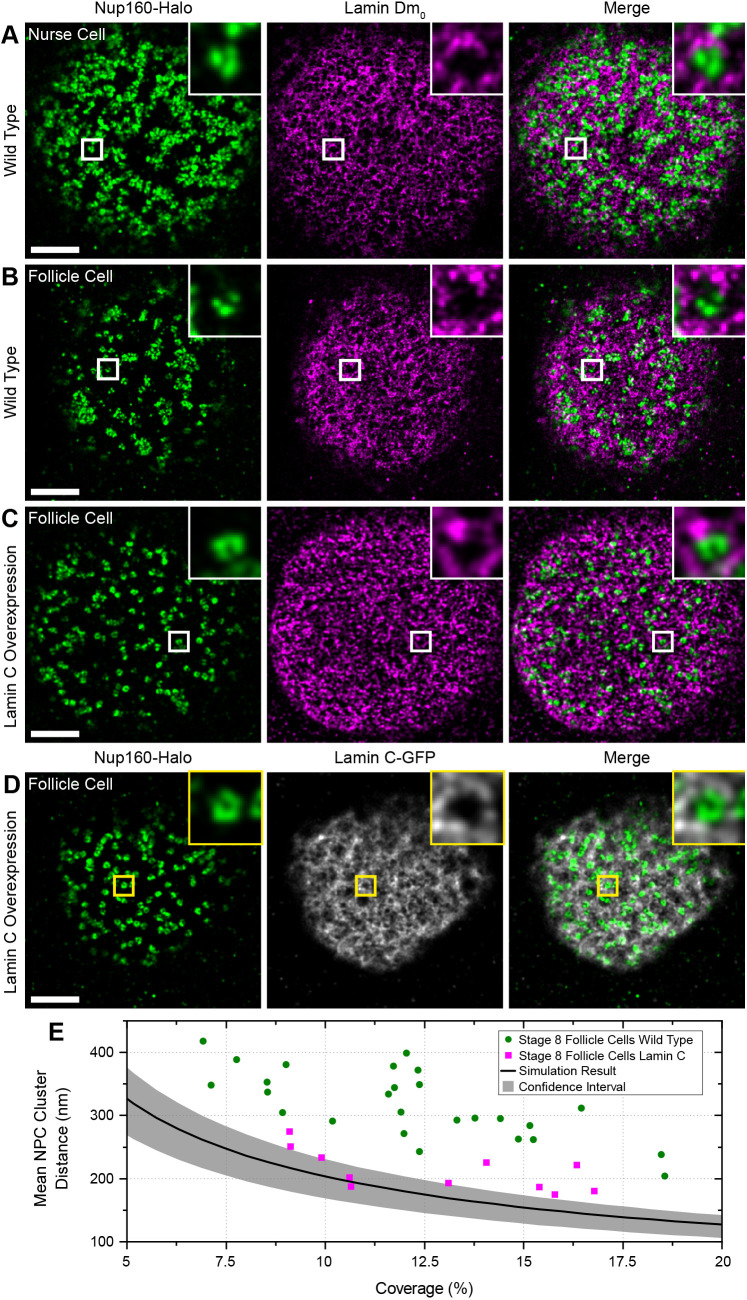
Fig. 7.
Lamin C inhibits NPC clustering. (A) DNA-PAINT image of Nup160–Halo (green) and Lamin Dm0 (magenta) in a wild-type nurse cell. The NPC clusters mainly fall in the gaps in the Lamin matrix. (B) DNA-PAINT image of Nup160–Halo (green) and Lamin Dm0 (magenta) in a wild-type follicle cell nucleus. Again, the NPC clusters anti-correlated with Lamin Dm0 (column 2). (C) DNA–PAINT image of Nup160–Halo (green) and Lamin Dm0 (magenta) in a follicle cell nucleus over-expressing GFP- Lamin C. The NPCs are less clustered, and Lamin Dm0 appears to form shorter and more globular clusters. (D) DNA-PAINT image of Nup160–Halo (green) and GFP–Lamin C (greyscale) in a follicle cell nucleus over-expressing GFP–Lamin C. (E) A graph showing the mean NPC cluster distance as a function of the proportion of the nuclear envelope covered by NPCs for wild-type and Lamin C-expressing follicle cell nuclei. The Lamin C-expressing nuclei show a more random distribution of NPC. Scale bars: 1 µm.

