Fig. 1.
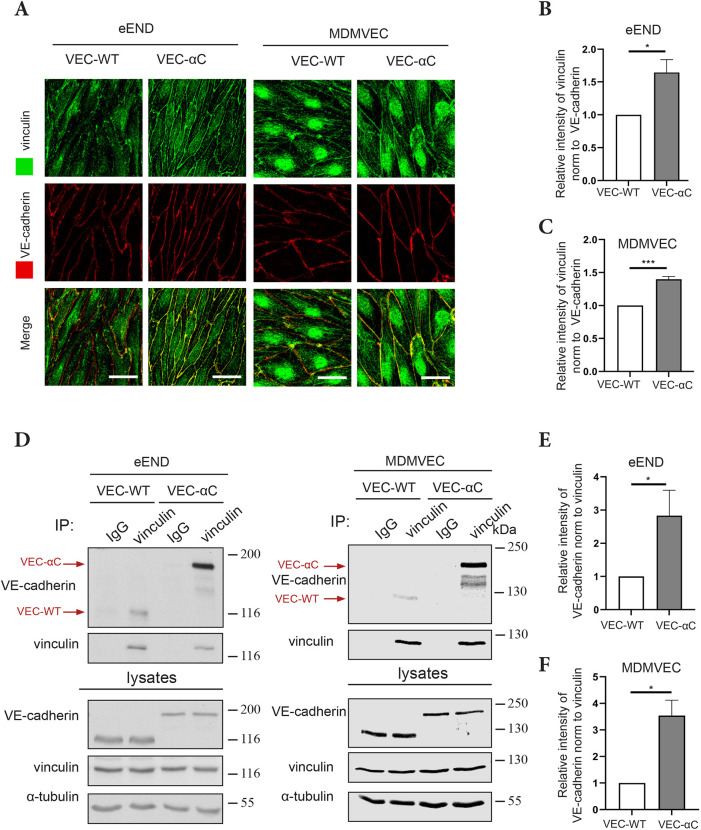
VEC-αC strongly associates with vinculin. (A) eEND cells or MDMVECs from VEC-WT and VEC-αC mice were fixed and stained for indicated antigens. Scale bars: 20 µm. (B,C) Quantification of vinculin signal intensities at cell contacts relative to VE-cadherin signal intensities as shown in A (n=3 independent experiments). (D) Vinculin was precipitated from cell lysates of eEND cells or MDMVECs using anti-vinculin antibodies or isotype-matched control antibodies. Immunoprecipitates or cell lysates were analyzed by SDS-PAGE and immunoblotted for VE-cadherin, vinculin or α-tubulin. Positions of molecular mass markers are indicated on the right. The lysate blots show 2% of input. (E,F) Quantification of VE-cadherin signal relative to vinculin signal intensities as shown in D (E, n=5; F, n=3 independent experiments). Results are shown as means±s.e.m. *P≤0.05; ***P≤0.001 (unpaired two-tailed Student's t-test).

