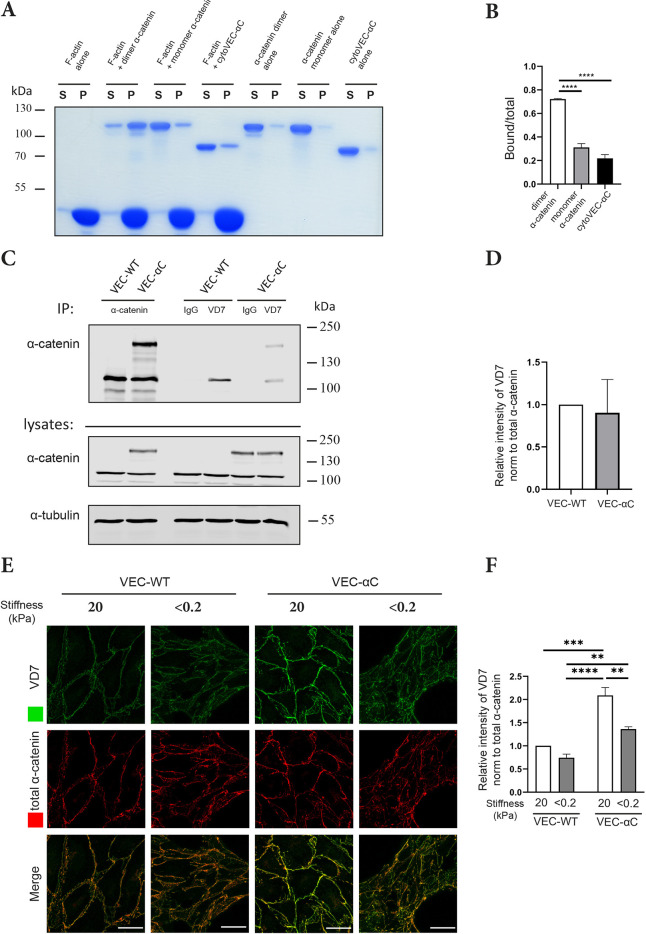
Fig. 8.
Comparison of VEC-αC and α-catenin binding to F-actin. (A) Sedimentation of dimeric and monomeric α-catenin and cytoVEC-αC in the presence and absence of F-actin. Supernatant containing the unbound protein (S) and pellet containing actin-bound protein (P) were analyzed by Coomassie-stained SDS-PAGE. (B) Quantification of actin-bound/ total fractions of the various recombinant forms of α-catenin as shown in A (n=3 independent experiments). (C) MDMVECs from VEC-WT or VEC-αC mice were subjected to immunoprecipitations with anti-total α-catenin, VD7 antibodies or control IgG (as indicated), followed by immunoblotting for α-catenin (upper panels); cell lysates were immunoblotted for the indicated antigens (bottom panels; 2% of input). The position of molecular mass markers are indicated on the right. (D) Quantification of VD7 signal relative to total α-catenin signal intensities as shown in C (n=4 independent experiments). (E) MDMVECs from VEC-WT or VEC-aC mice were grown on collagen-coated polyacrylamide gels of varying stiffness of <0.2 and 20 kPa for 72 h. Cells were fixed, permeabilized, and stained with VD7 and total α-catenin antibodies. (F) Quantification of VD7 signal intensities at cell contacts relative to total α-catenin signal intensities as shown in E (n=3 independent experiments). Results are shown as means±s.e.m. **P≤0.01; ***P≤0.001; ****P≤0.0001 [one-way ANOVA (B) or two-way ANOVA (F) with Tukey's multiple comparisons test, or the unpaired two-tailed Student's t-test (D)].

