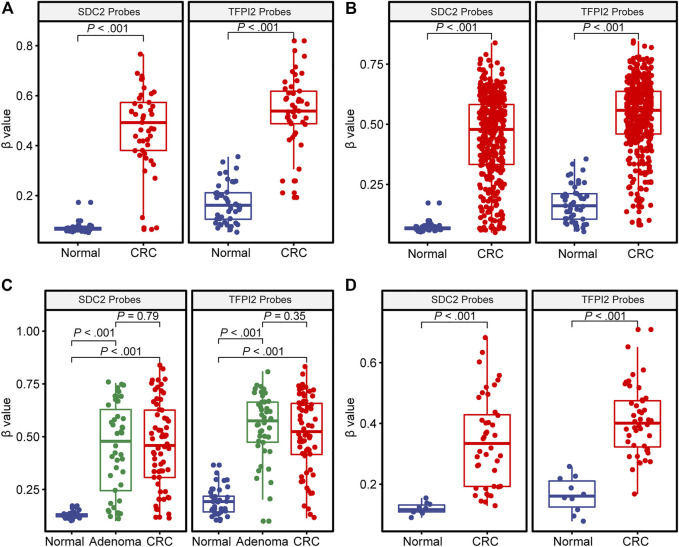
FIGURE 1.
DNA methylation level (β value) of SDC2 and TFPI2 in CRC, adenoma, and normal tissues. The abscissa is the type of tissue, and the ordinate is the methylation level (β value). Each dot indicates an individual specimen. The extremes of the boxes define the upper and lower quartiles, and the center lines define the median. Whiskers indicate 1.5×interquartile range (IQR). Beyond IQR are defined the outliers. (A) illustrates the distribution of methylation levels in 45 CRC specimens vs. their paired normal tissue specimens from TCGA. (B) shows 391 CRC vs. 45 normal tissue specimens from TCGA. (C) is based on the dataset of GSE48684, with 106 CRC, 42 adenoma, and 41 normal tissue specimens. (D) is based on GSE79740, with 44 CRC and 10 normal tissue specimens. The Wilcoxon signed-rank test was used for (A) and Mann–Whitney U test for (B–D).

