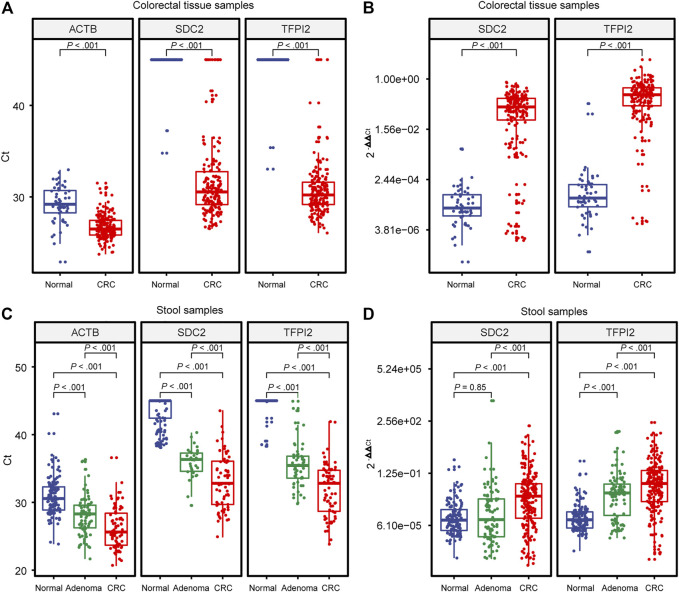
FIGURE 2.
Distribution of Ct and 2−ΔΔCt values generated by MSP. (A) and (B) are built on colorectal tissue specimens. (C) and (D) are built on stool specimens. Each dot indicates an individual specimen. The extremes of the boxes define the upper and lower quartiles, and the center lines define the median. Whiskers indicate 1.5×interquartile range (IQR). Beyond IQR are defined the outliers. Statistically significant differences were determined using the Mann–Whitney U test, with a significant level of p < 0.05 and a highly significant level of p < 0.01.

