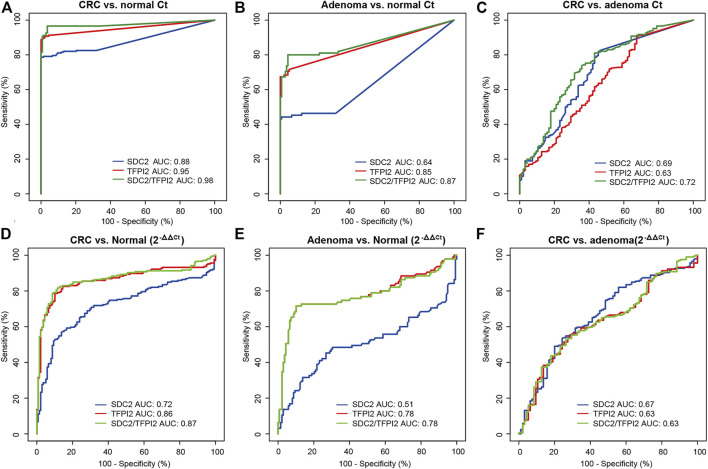
FIGURE 3.
Diagnostic performances of methylation-specific PCR targeting SDC2, TFPI2, and SDC2/TFPI2 in stool specimens. (A–C) are ROC curves based on Ct values, for cancer vs. normal, adenoma vs. normal, and cancer vs. adenoma, respectively. (D–F) are ROC curves based on ML values, for cancer vs. normal, adenoma vs. normal, and cancer vs. adenoma, respectively. Ct values are obtained in stool specimens by methylation-specific PCR. ML = 2-ΔΔCt, in which ΔΔCt = (Ct target - Ct ACTB )sample - (Ct target - Ct ACTB )positive control. AUC means the area under the curve.

