Figure 1.

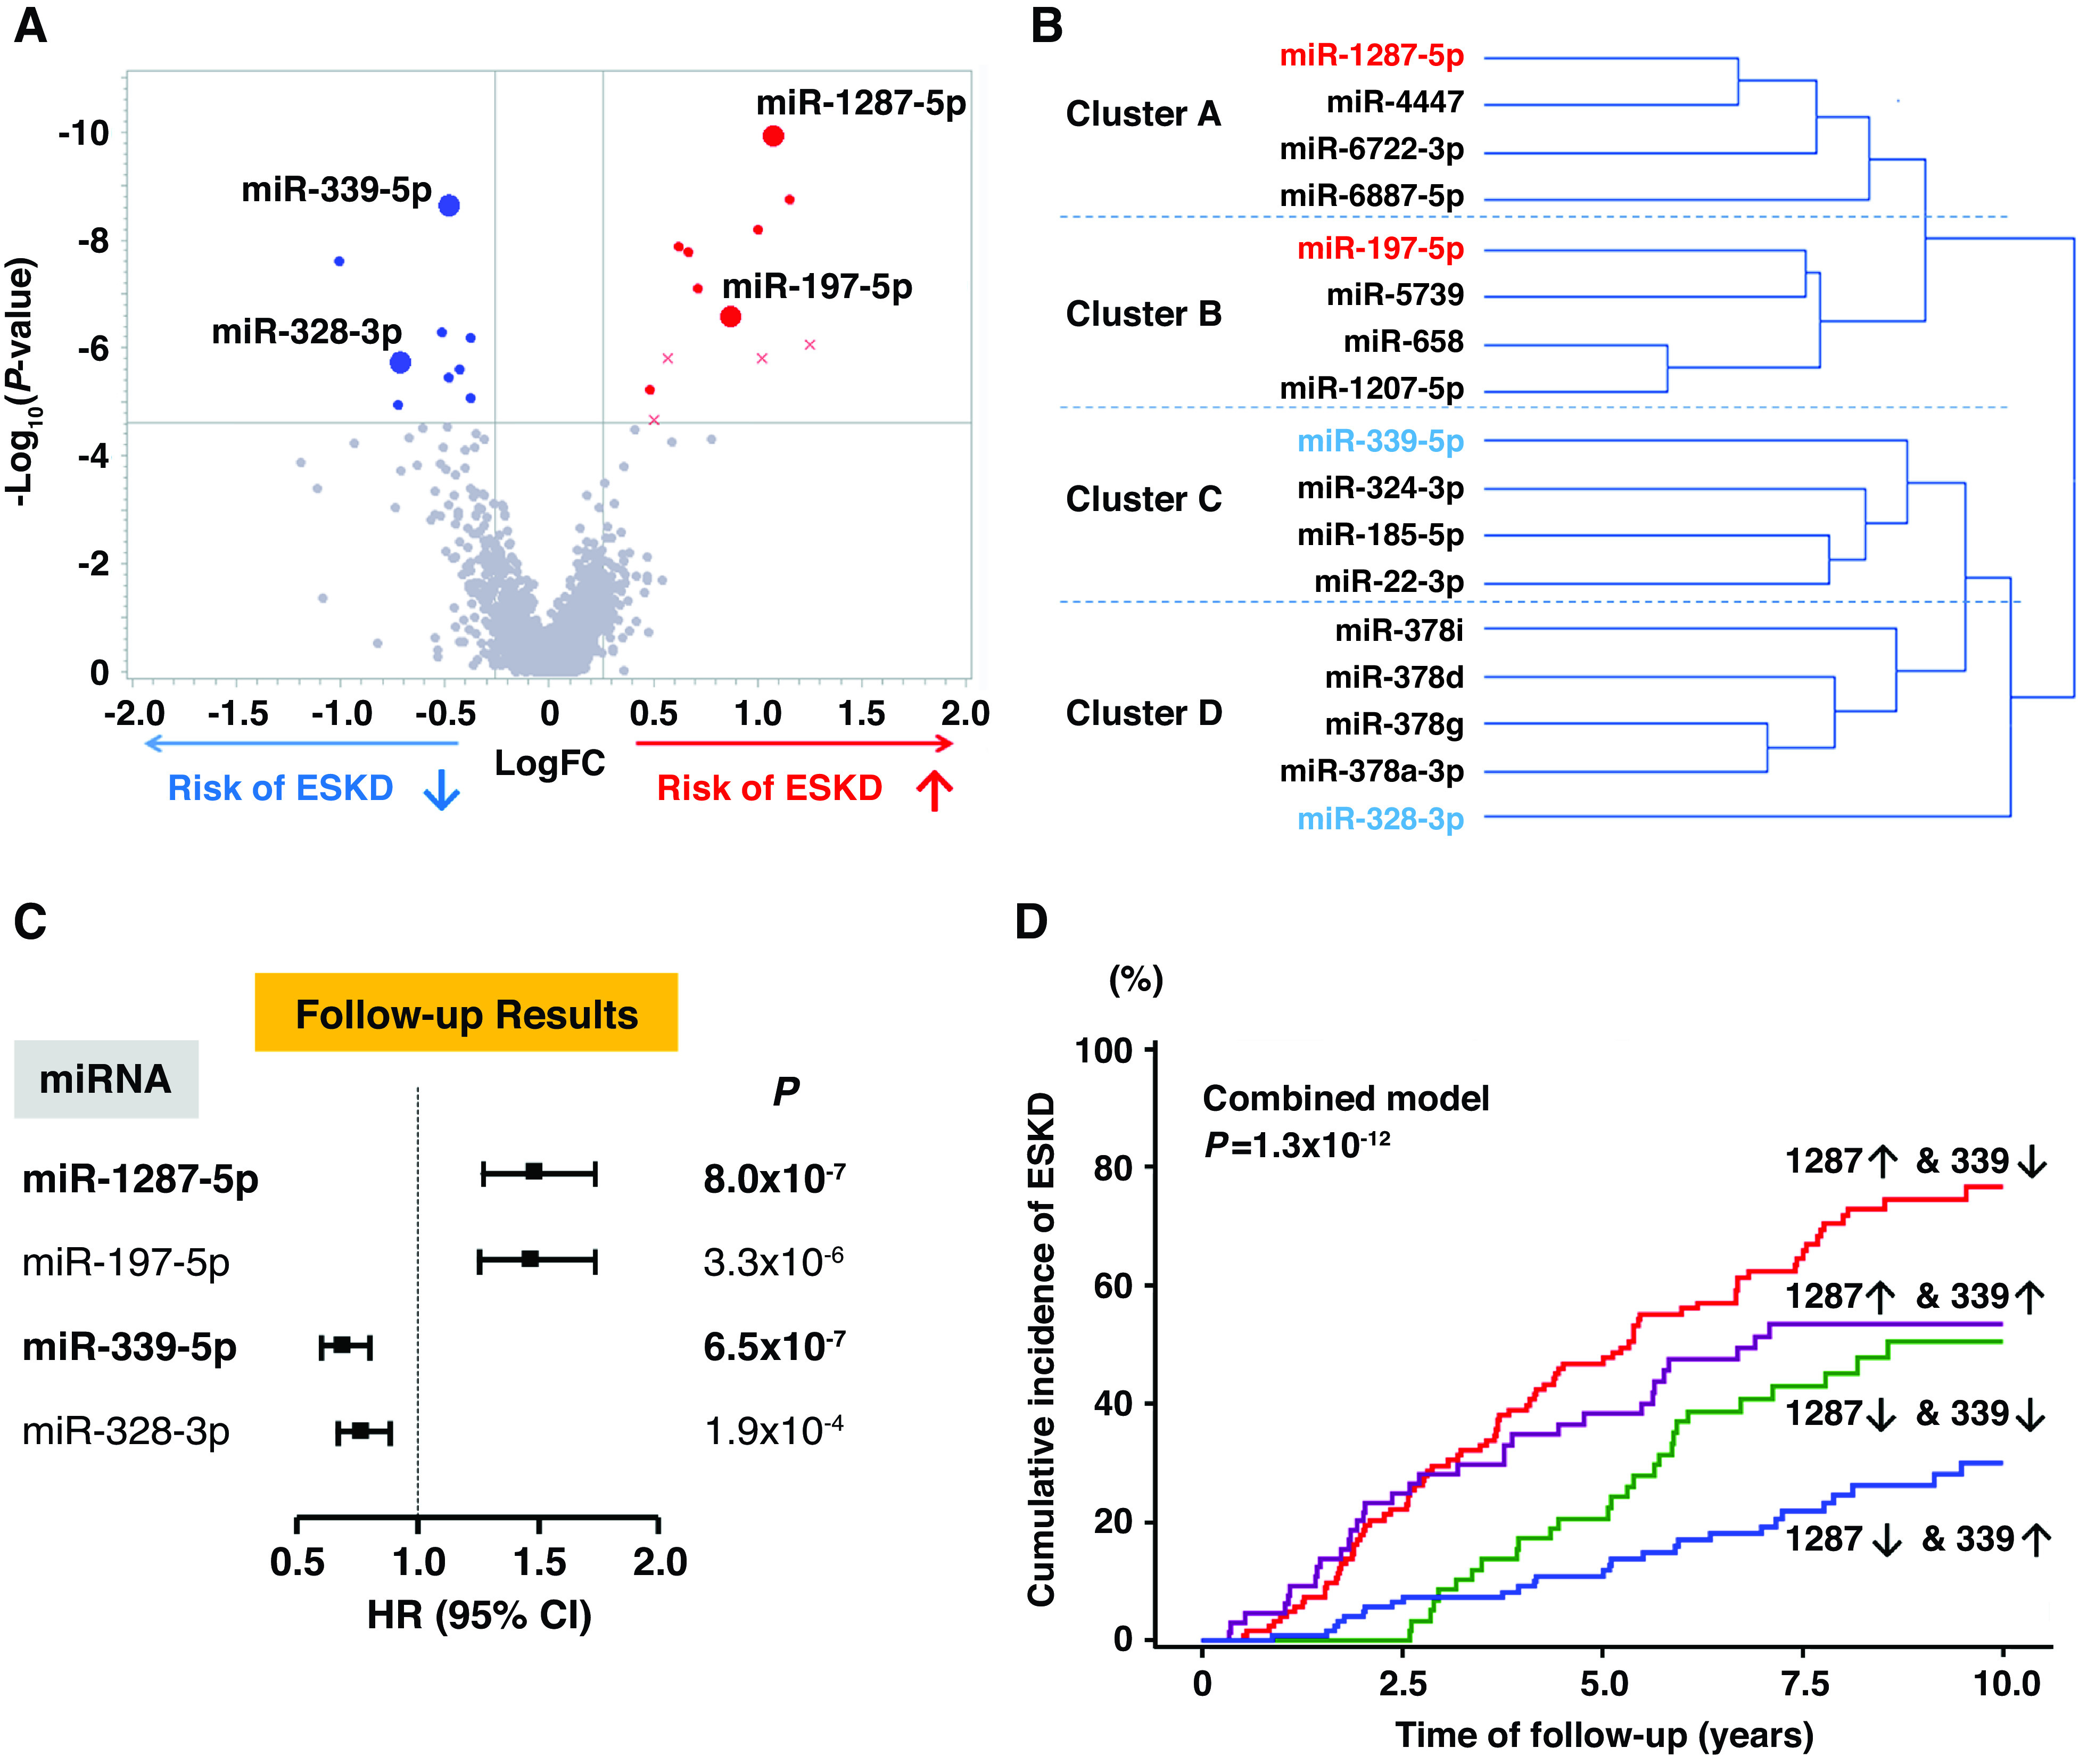
Profile of circulating miRNAs associated with risk of progression to ESKD during 10-year follow-up. (A) Volcano plot of fold changes (FC) and P values for 2083 miRNAs measured in plasma at baseline in 127 subjects with T1D who developed ESKD, compared with 112 subjects with T1D who did not progress to ESKD. A total of 21 miRNAs were associated with risk of ESKD (Bonferroni corrected), and 17 of them were confirmed in the T2D replication cohort (upregulated miRNAs in red, downregulated miRNAs in blue, nonreplicated miRNAs are shown as “x”). Exemplar miRNAs representing different clusters (listed in [B]) are identified in the plot. (B) Cluster analysis of the 17 candidate miRNAs in the combined late DKD cohorts (n=375). The miRNAs in red and blue are exemplar miRNAs that had the strongest association with time to ESKD in Cox models in each cluster (see Supplemental Table 3). (C) HRs with 95% CIs for time to onset of ESKD according to baseline plasma levels of exemplar miRNAs in the combined late DKD cohorts (n=375). Estimates are per one-quartile increase in plasma level of an miRNA after adjusting for clinical covariates important for the etiologic model, i.e., sex, duration of diabetes, systolic BP, baseline HbA1c, and eGFR, with variable stratification by study cohort. For distribution of values of exemplar miRNAs, see Supplemental Figure 3. (D) Cumulative incidence of ESKD according to baseline plasma levels of miR-1287-5p and miR-339-5p in the combined late DKD cohorts. An upward arrow (↑) indicates miRNA level above (inclusive of) the median, and a downward arrow (↓) indicates miRNA level below the median. For statistical analysis, see Supplemental Table 4.
