Figure 2.

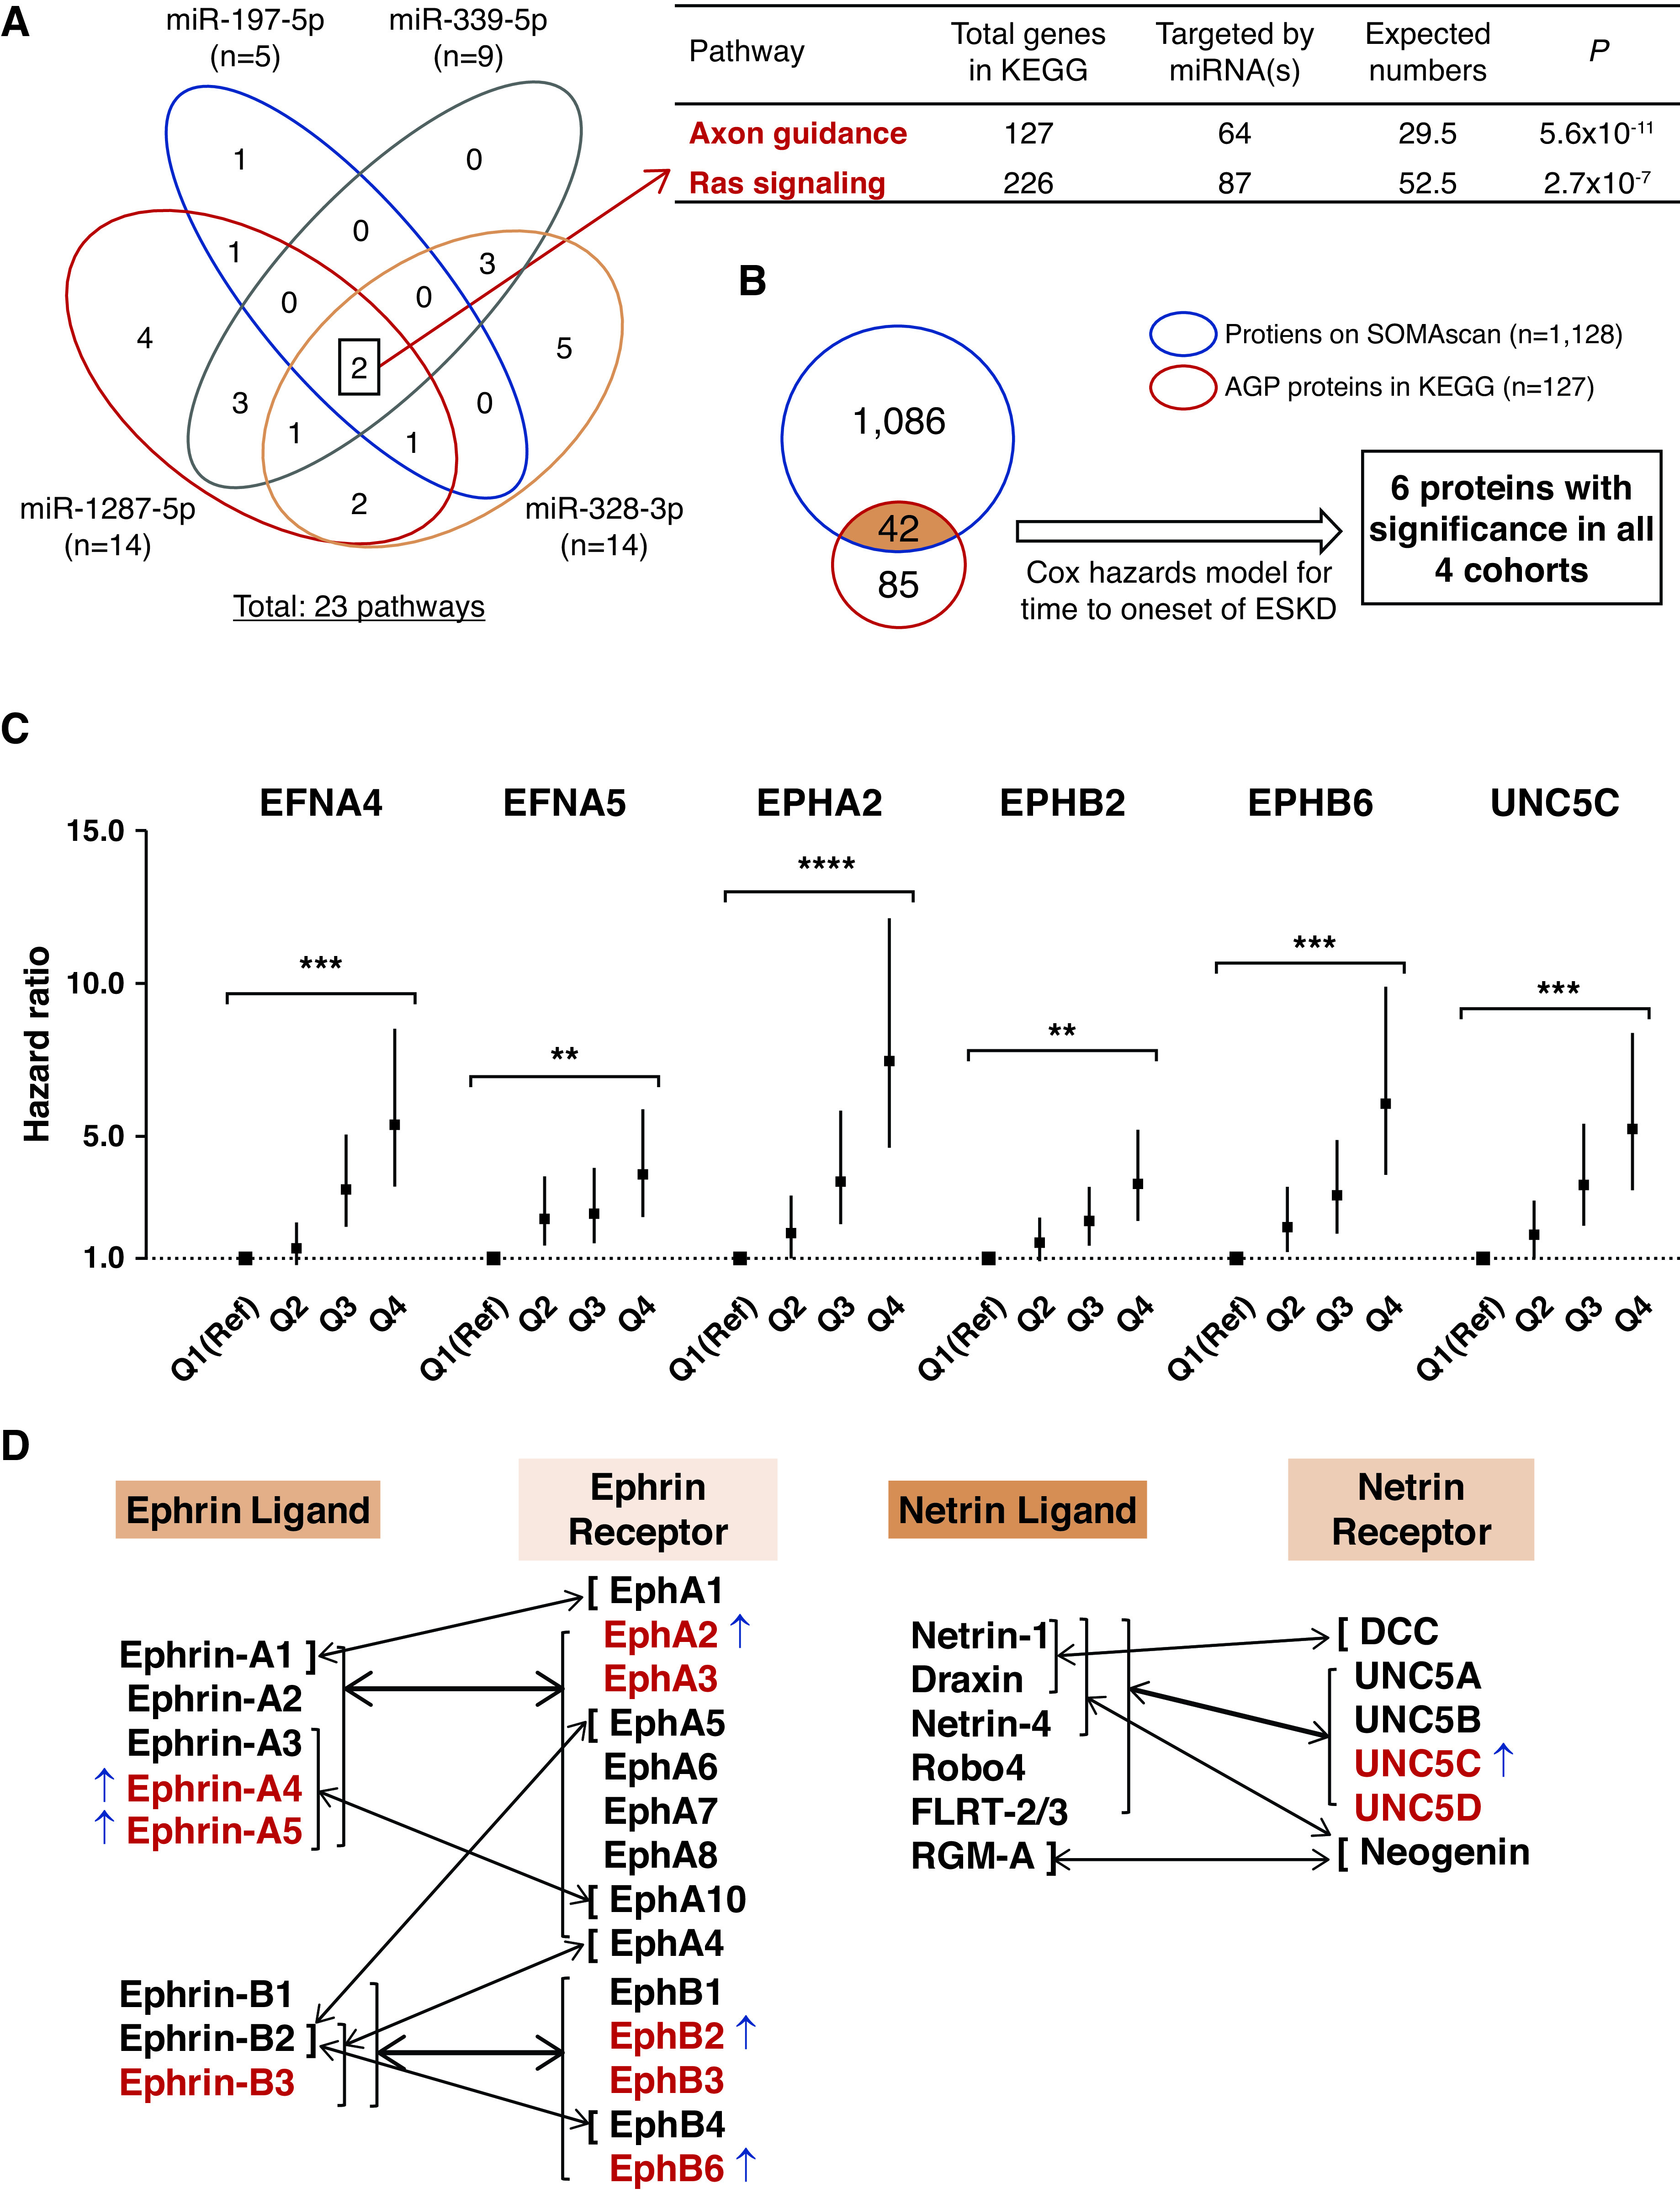
Profile of circulating AGP proteins associated with risk of progression to ESKD during 10-year follow-up. (A) Venn diagram of 23 KEGG pathways enriched by predicted genes targeted by four exemplar miRNAs. There were two overlapping pathways, AGP and Ras signaling pathways, which were enriched by genes targeted by these four miRNAs. (B) Among 127 AGP proteins, 42 were measured by the SOMAscan platform. In Cox regression analysis, the baseline plasma concentration of six AGP proteins were associated with risk of ESKD in each of the four cohorts (see Table 2). (C) HRs with 95% CIs for time to onset of ESKD according to baseline plasma levels of the six AGP proteins in the combined four cohorts (n=745). Estimates are per one-quartile increase (discrete variable) in plasma level of the AGP proteins after adjusting for clinical covariates important for the etiologic model, i.e., sex, duration of diabetes, systolic BP, baseline HbA1c, and eGFR, with variable stratification by study cohort. P values for comparison of quartile 4 (Q4) versus Q1 (Reference [Ref]) are shown (see Table 2). For distribution of values for the six AGP proteins, see Supplemental Figure 4. (D) Binding preferences for Ephrin and Netrin ligands and receptors. Thin arrows indicate selective binding of one ligand with one receptor. Thick arrows represent multiple ligands binding to multiple receptors. Of the 14 AGP proteins available on the SOMAscan platform (in red), six were elevated (indicated with ↑) in subjects at risk of ESKD in the study cohorts. FLRT-2/3, fibronectin and leucine-rich transmembrane protein 2 and 3; RGM-A, repulsive guidance molecule-A. **P<10−7, ***P<10−11, ****P<10−15.
