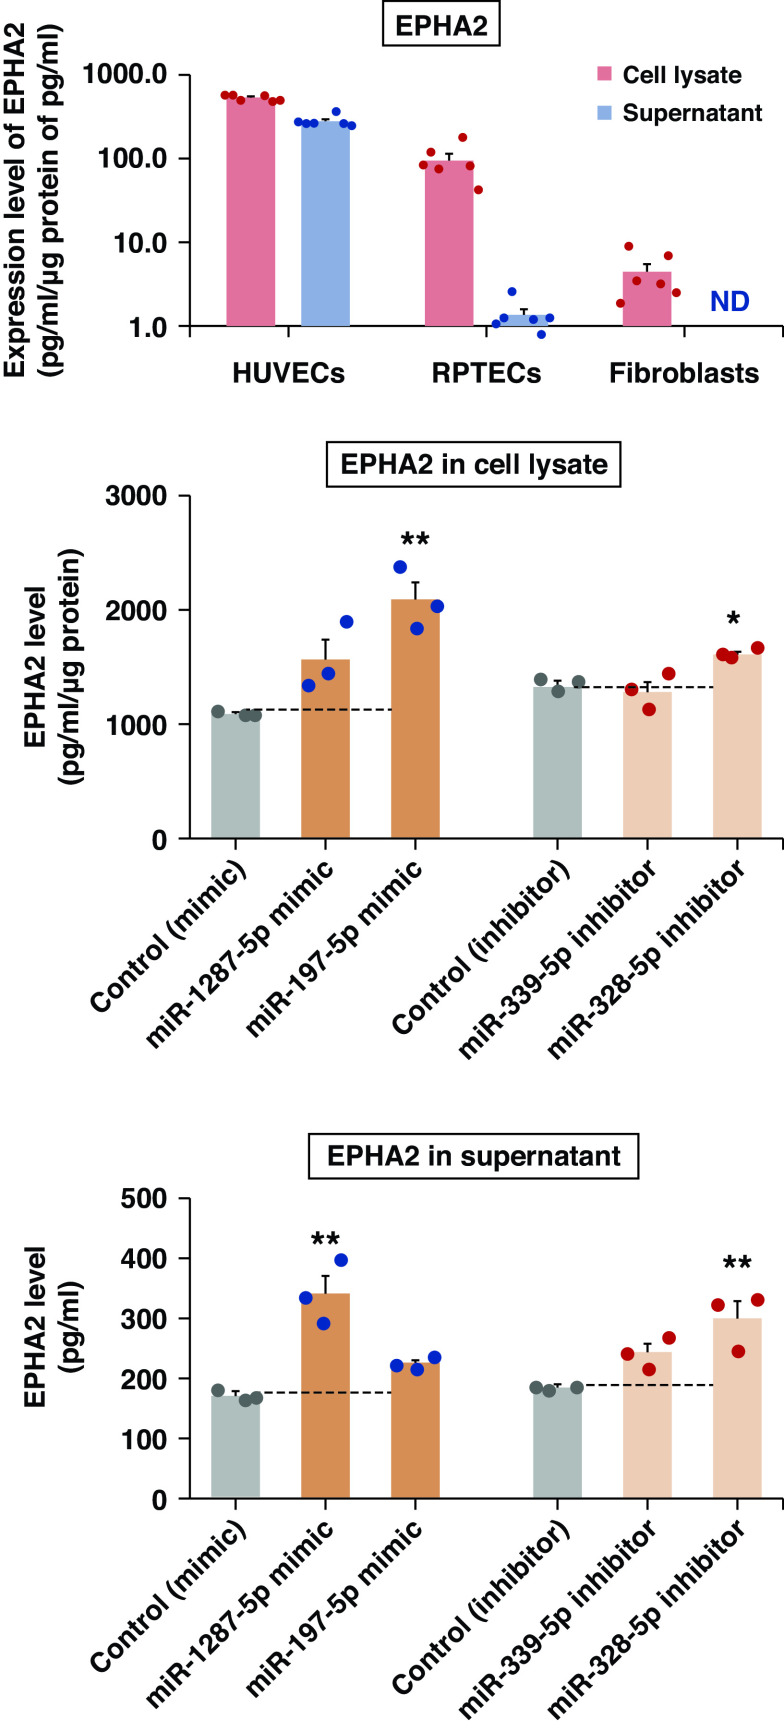
Figure 8.
Transfection of miRNA mimics and inhibitors into HUVECs increased levels of EPHA2. (A) Expression levels of EPHA2 in three human cell lines. The protein levels in cell lysate (pg/ml per μg protein) and supernatant (medium in which the cells were grown; pg/ml) were measured using the Olink platform (n=6). EPHA2 was not detected in supernatant from fibroblasts. EPHA2 levels in (B) cell lysate and (C) supernatant from HUVECs. HUVECs were transfected with 20 nM of miRNA mimics (blue) or inhibitors (red) (n=3). Cell lysates were normalized to the same protein concentration and measured using the Olink platform. Data are shown as means±SEMs of a representative experiment performed in triplicate. The gray bars indicate controls. ND, not detected. *P<0.05, **P<0.01.

