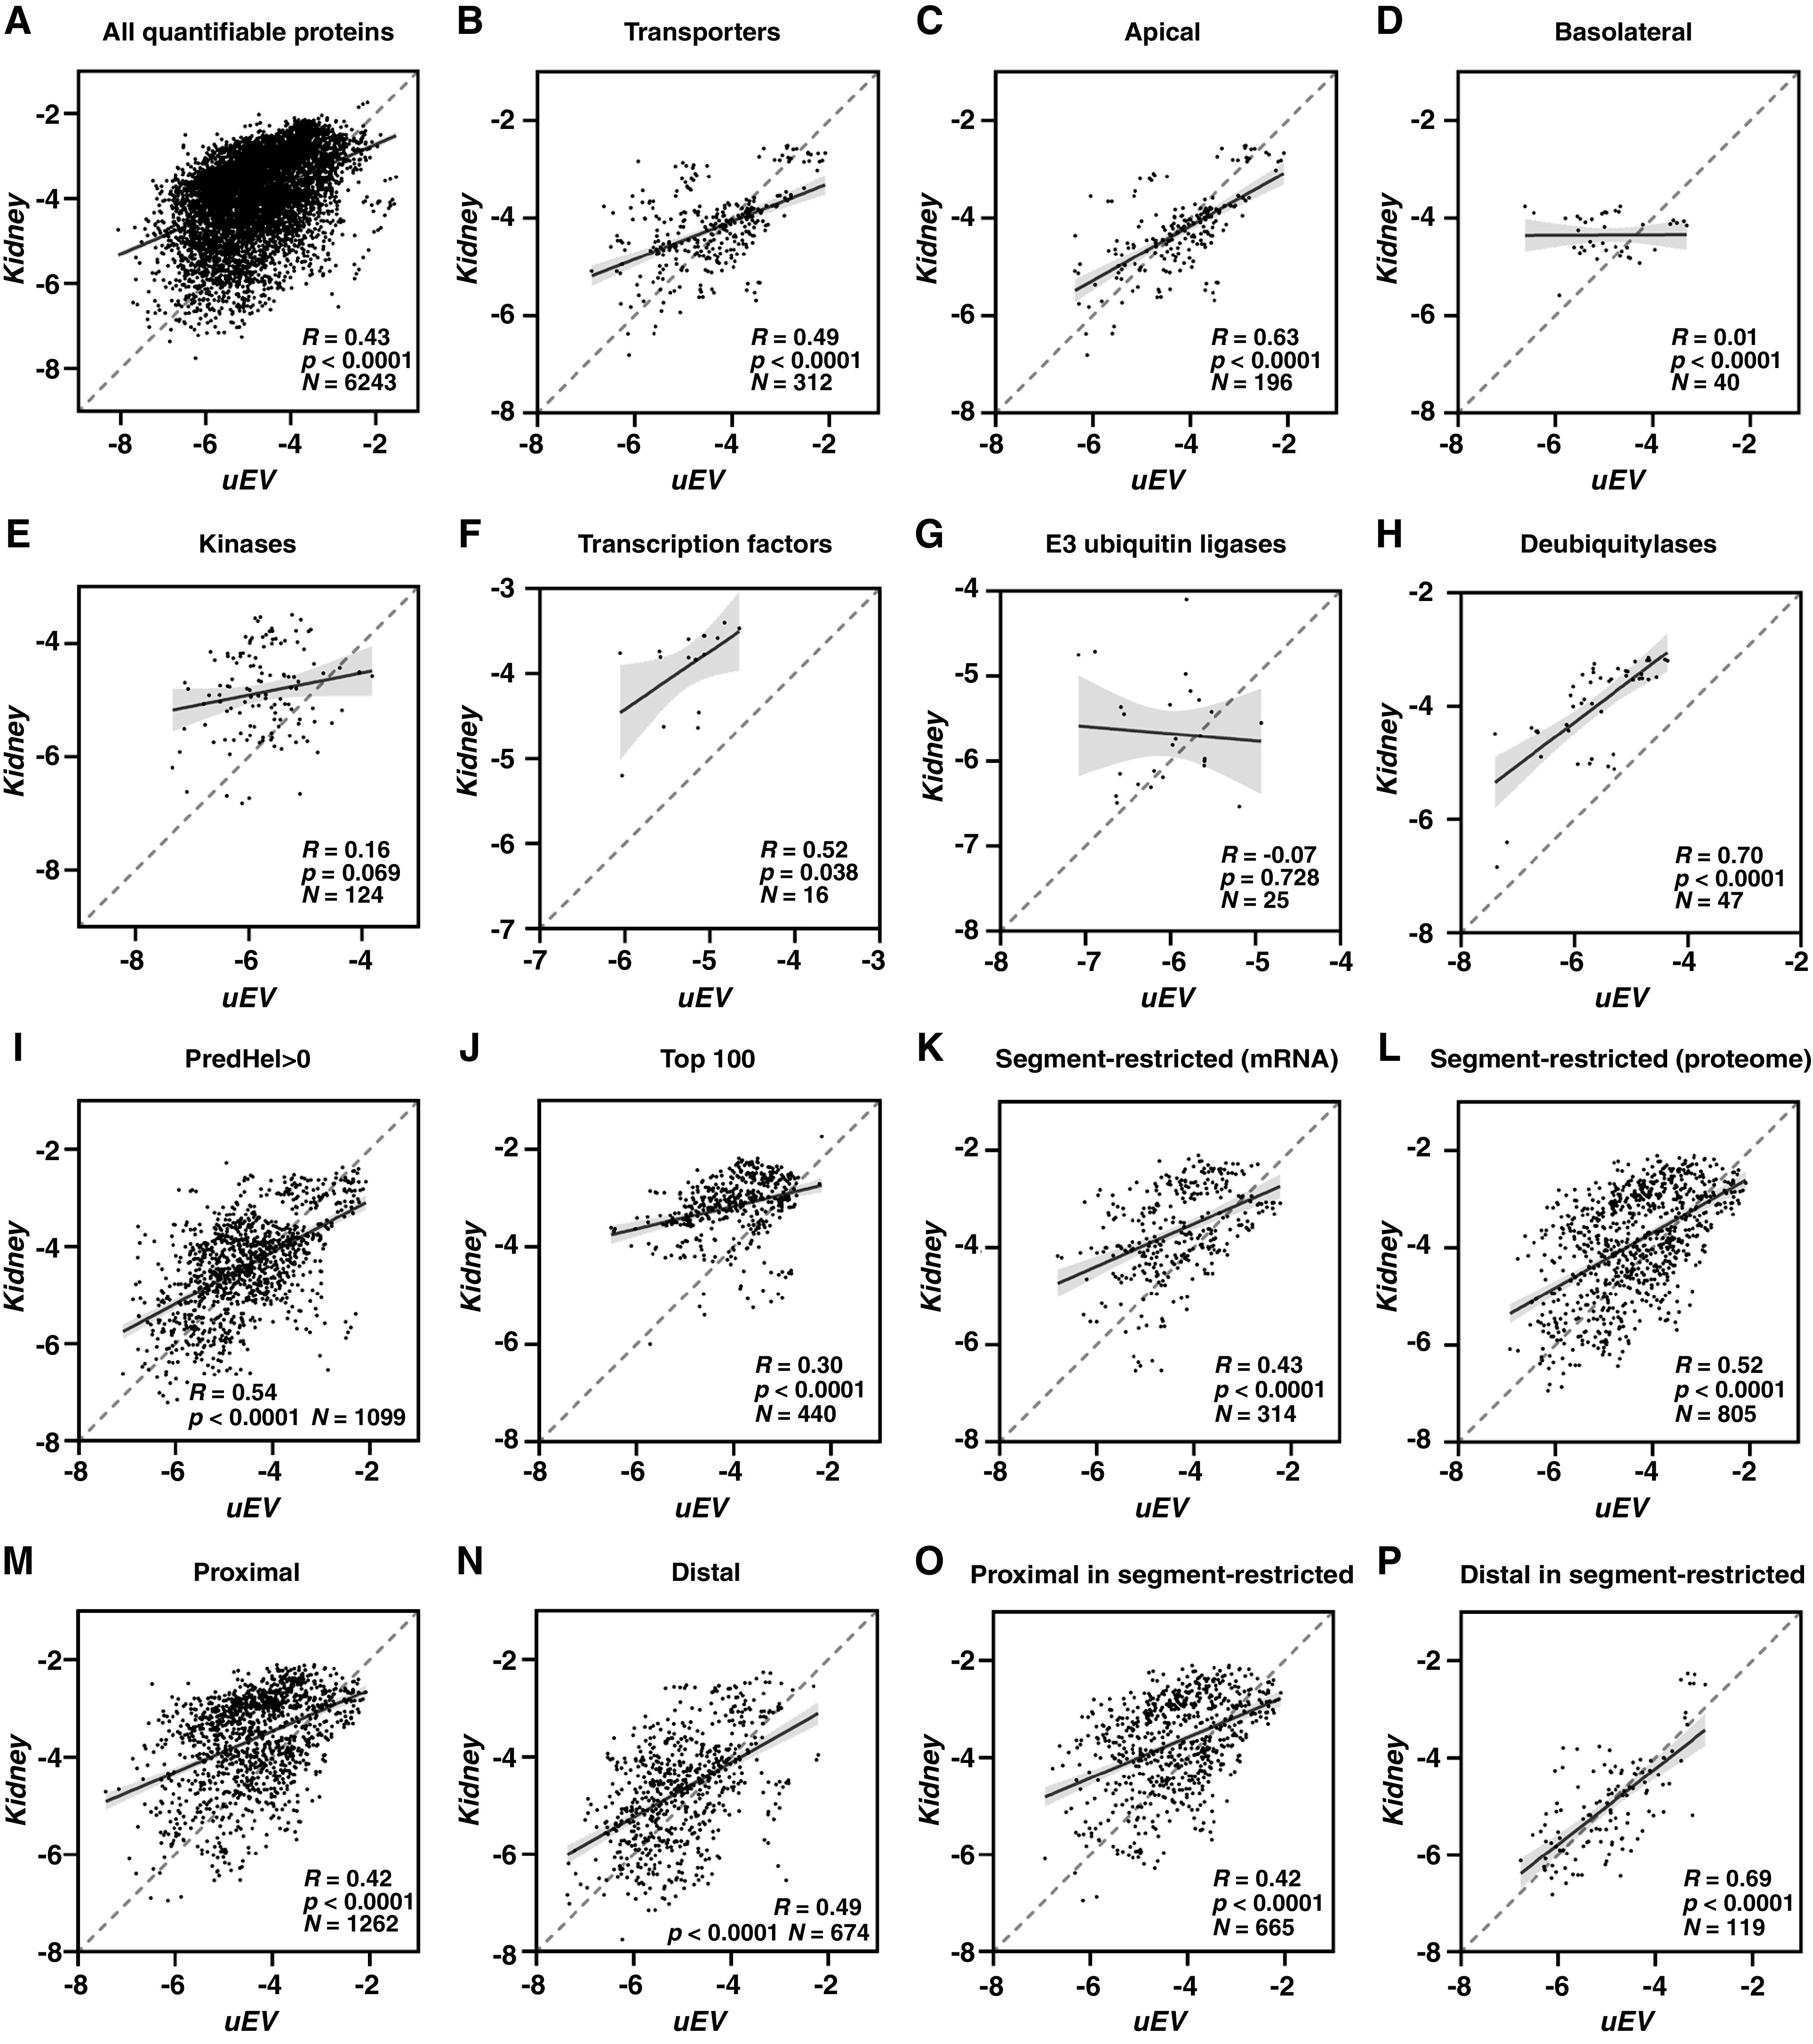
Figure 2.

Correlations of absolute protein abundances between uEVs and kidney on a high K+ diet showed highly similar trends to standard diet. The x axis denotes normalized Log10 iBAQ percentages for uEV, whereas the y axis denotes the same for kidney. R denotes Pearson’s correlation coefficient, P denotes the significance of Pearson’s correlation, and N denotes the number of data points in the figure. The dashed diagonal line denotes perfect positive correlation, the black line inside the cluster of dots denotes the actual linear regression line, and the gray area denotes the 95% confidence interval. See Figure 1 for detailed explanations of figure panels A-P.
