
Figure 3.
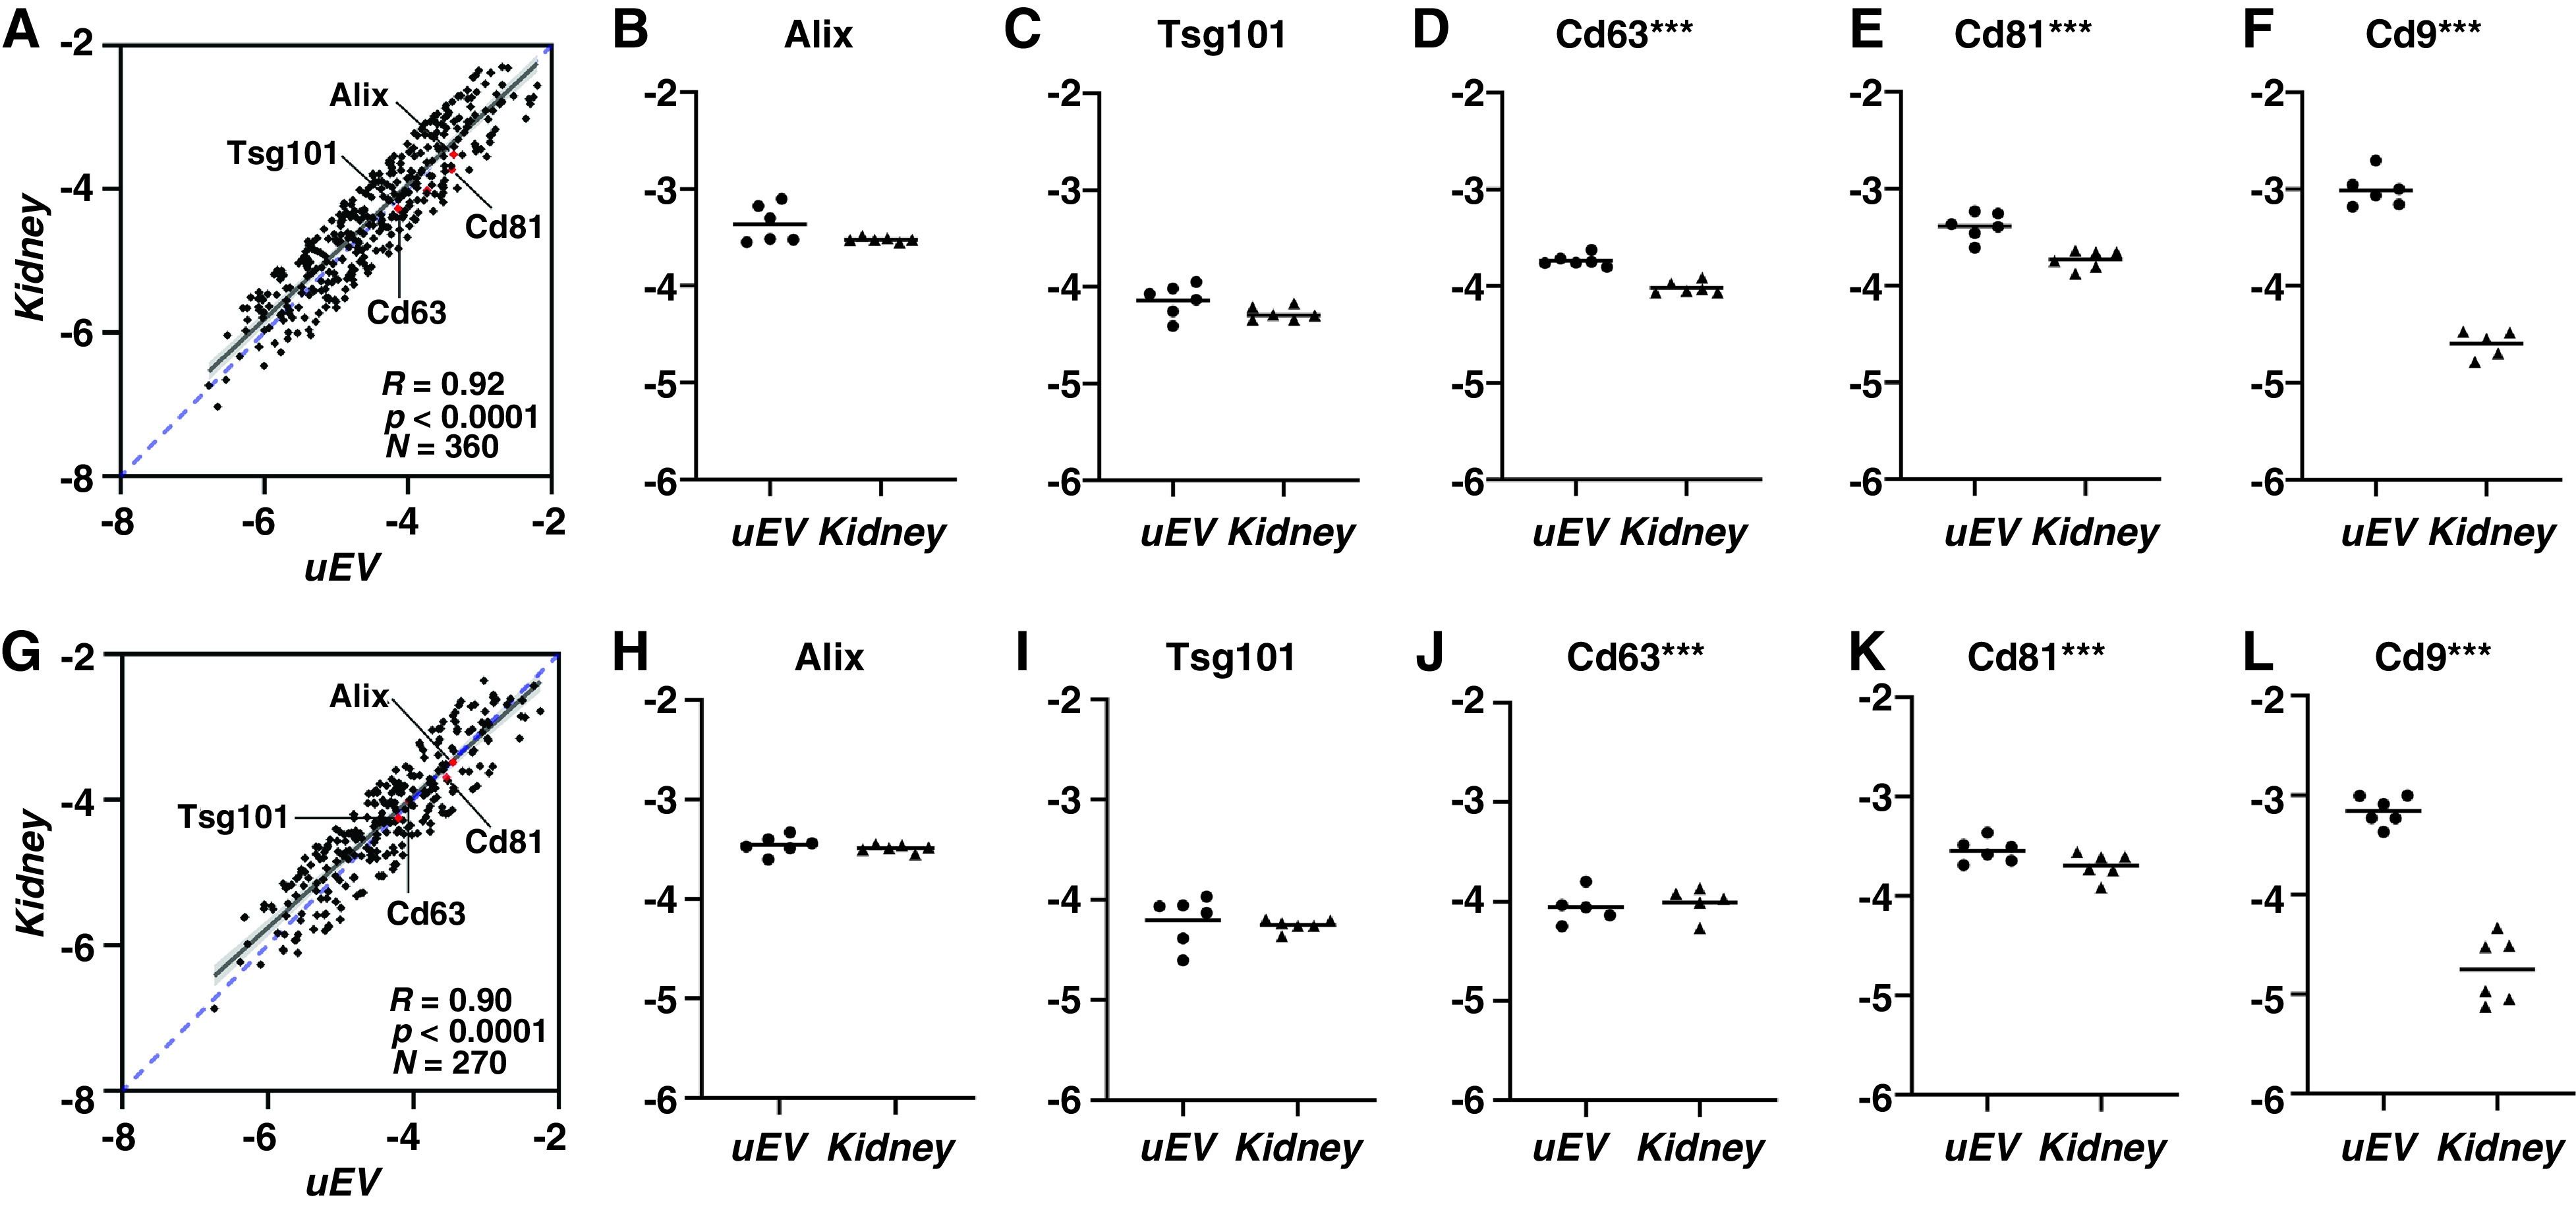
Highly correlated proteins and individual absolute protein levels for four uEV marker proteins in individual rats showed almost perfect correlations. (A–F): control diet; (G –L): high K+ diet. R denotes Pearson’s correlation coefficient, the blue dashed diagonal denotes perfect positive correlation, a single asterisk (*) denotes 0.01<P<0.05; a double asterisk (**) denotes 0.001<P<0.01; a triple asterisk (***) denotes 0.0001<P<0.001; and a quadruple asterisk (****) denotes P<0.0001. Although some proteins showed P<0.05, they still fulfilled the stringent criteria we set (except Cd9, see text). All axes denote normalized log10 iBAQ percentages for uEV or kidney. Cd9, an established marker protein for uEVs, had greater (100-fold) protein abundance in uEVs than in kidney.