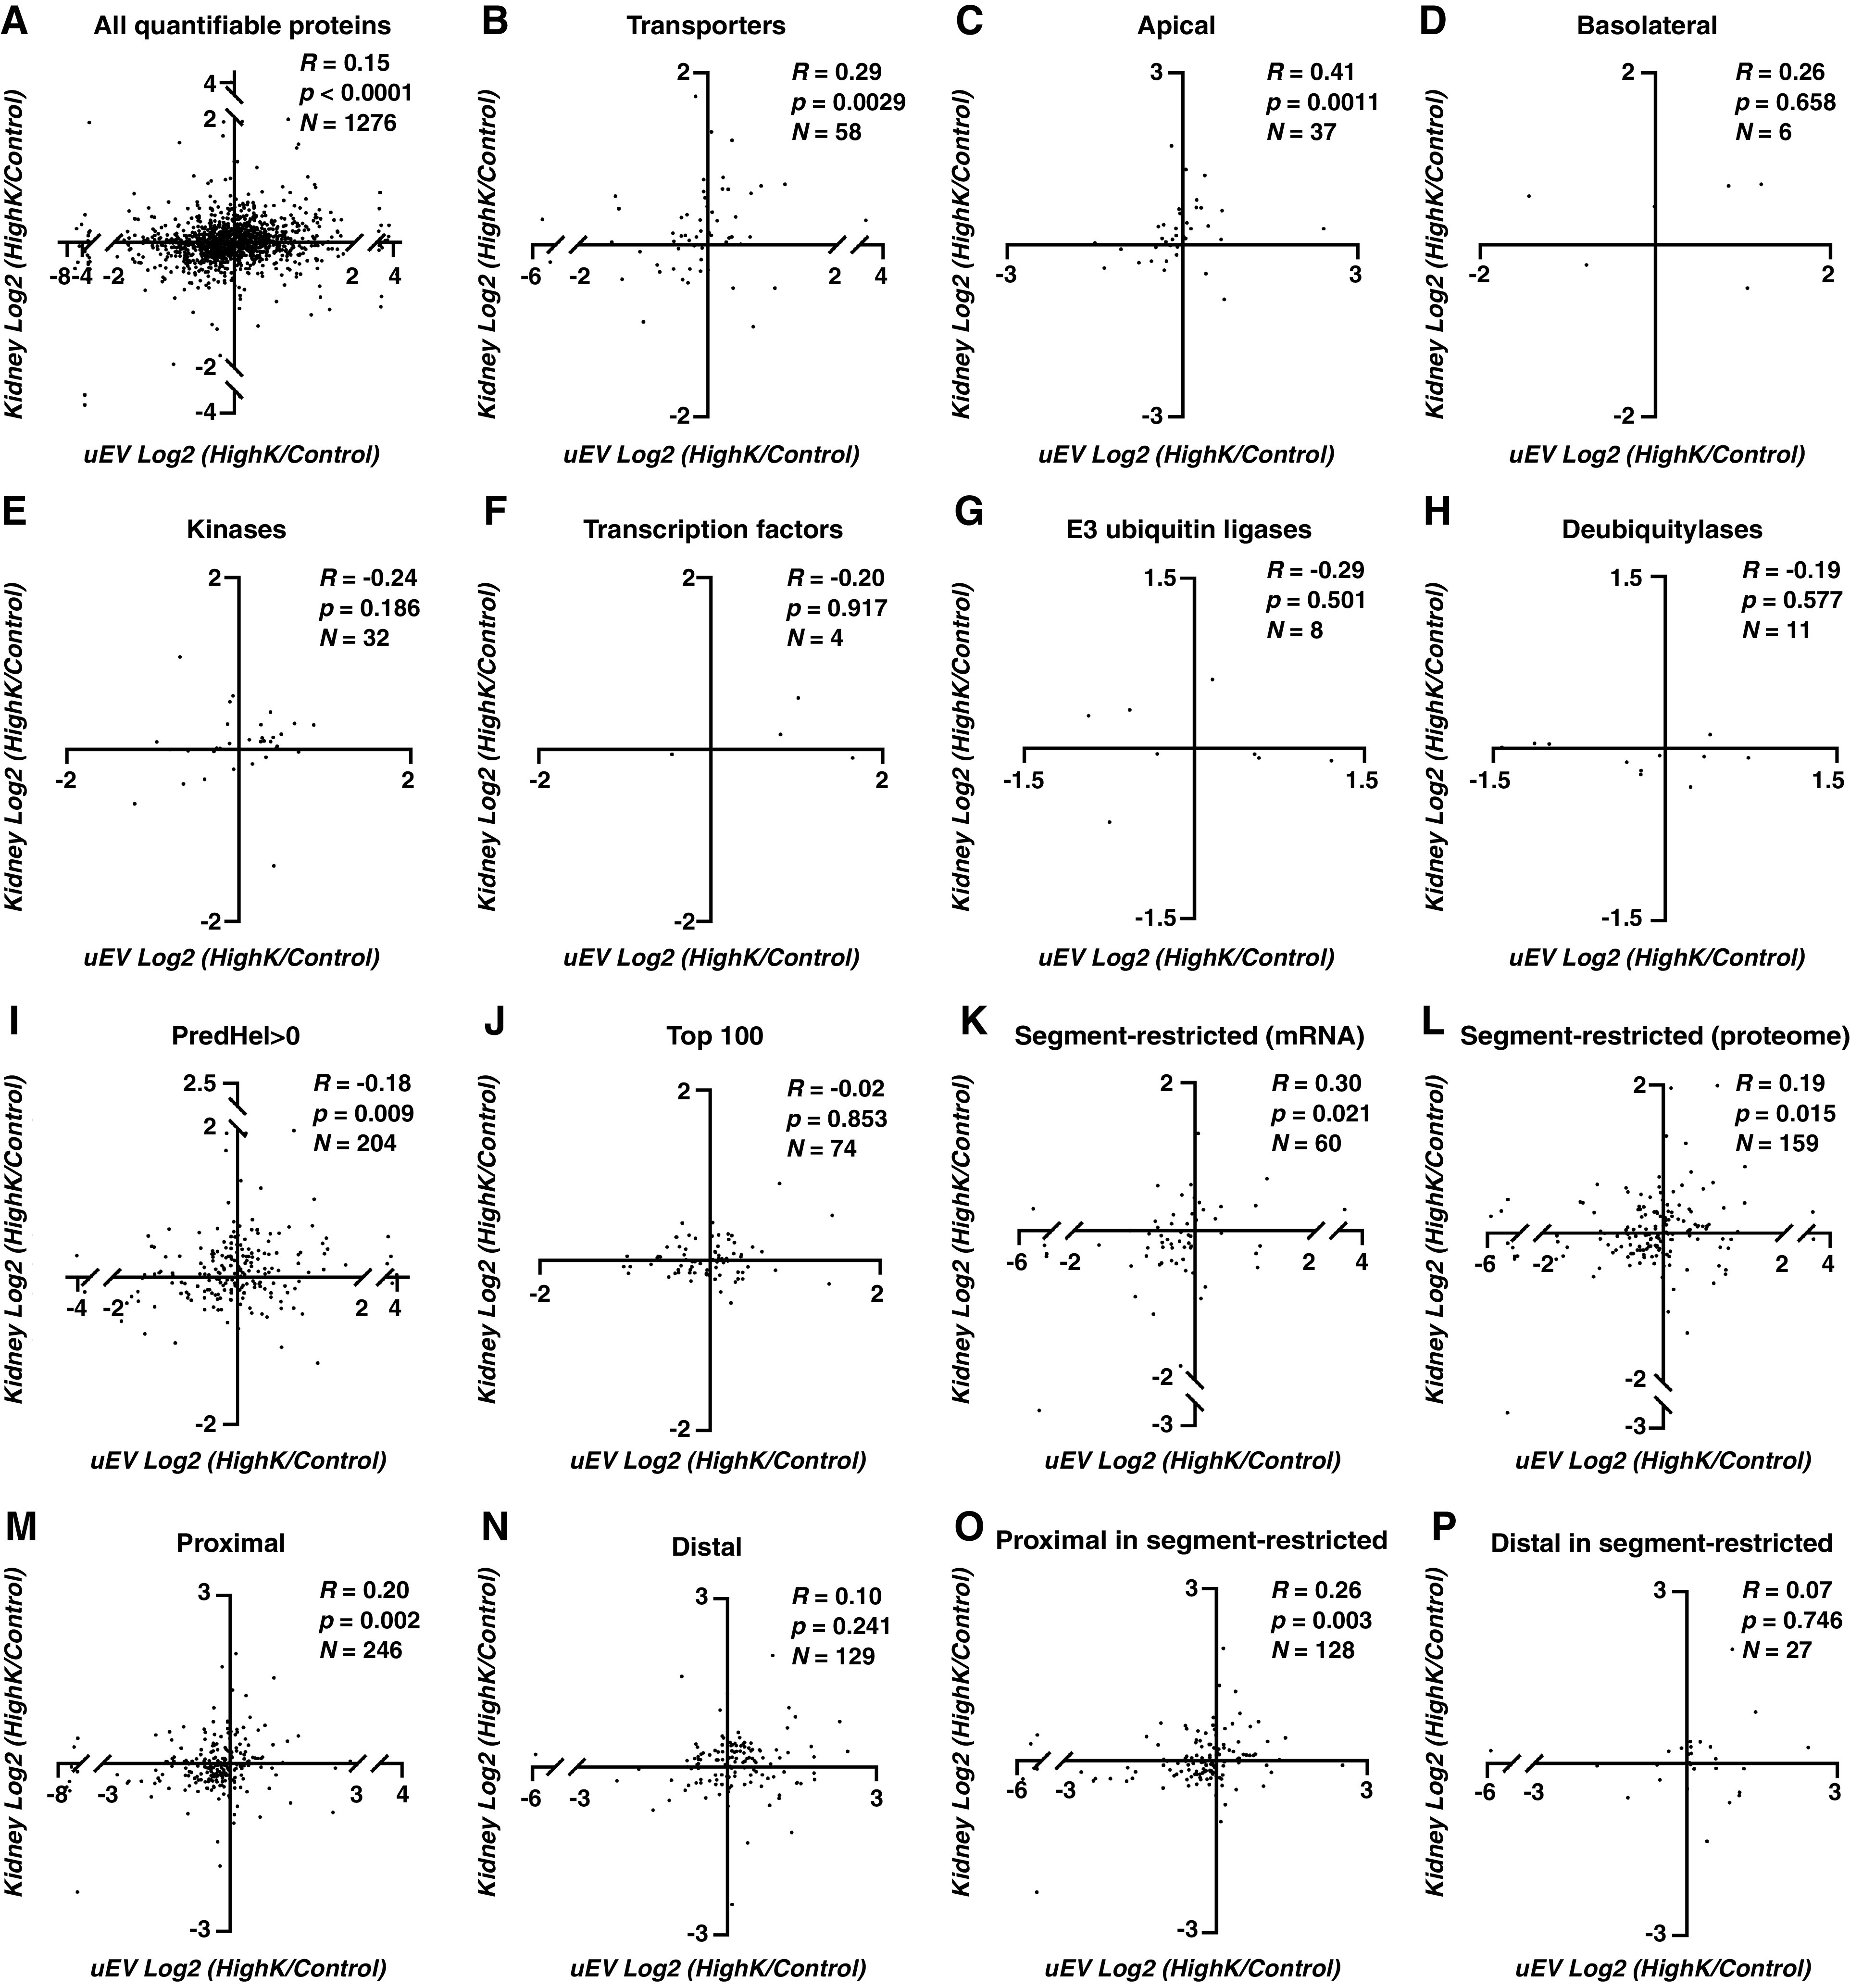
Figure 4.

Relative correlations of fold changes induced by diet (high K+ versus control) of the same protein between uEV and kidney showed higher correlations for transporter and segment-restricted proteins. R denotes Spearman’s correlation coefficient, P denotes the significance of Spearman’s correlation, N denotes the number of proteins in the figure. See Figure 1 for detailed explanations of figure panels A-P.
