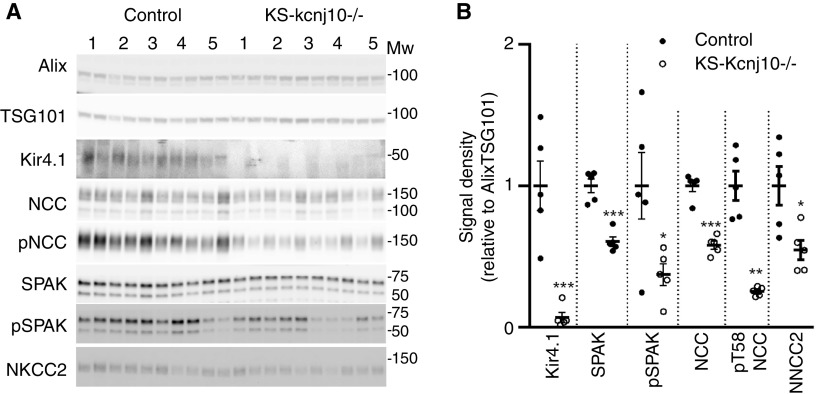
Figure 5.
Altered protein abundances in uEVs isolated from KS-kcnj10−/− are similar to those reported in the kidney. (A) uEVs were isolated from 24-hour urine and assessed by immunoblotting. Each duplet represents uEVs isolated from two sequential 24-hour collection periods from the same mouse. (B) Summary data of relative abundances of uEV proteins in control and KS-kcnj10−/− mice. Each data point represents the average abundance of the protein from the two 24-hour collection periods. Data correlate well with relative abundances reported in the literature (see text). A single asterisk (*) denotes 0.01<P<0.05; a double asterisk (**) denotes 0.001<P<0.01; and a triple asterisk (***) denotes 0.0001<P<0.001, relative to control.

