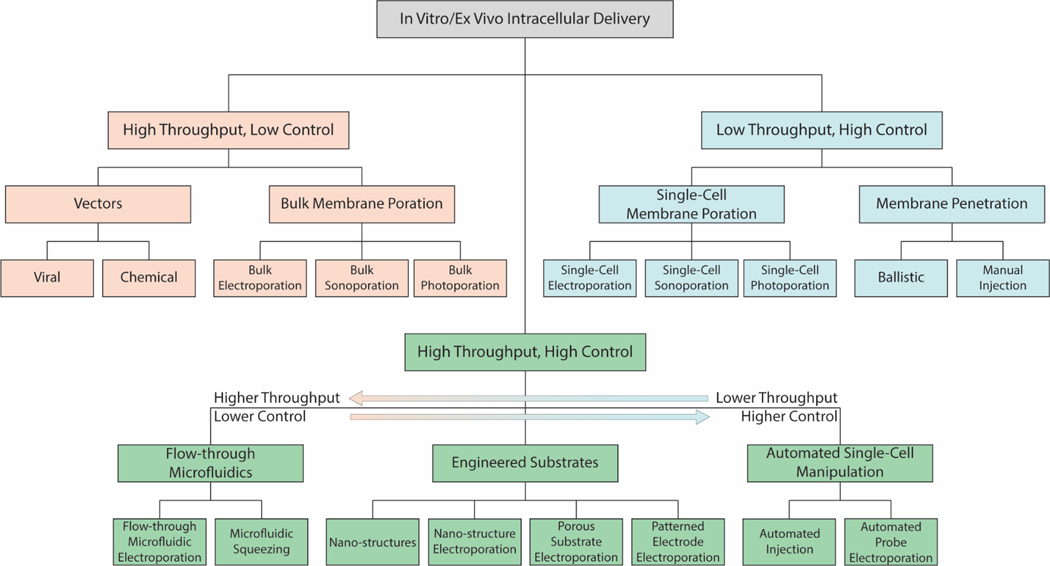
Figure 1. Throughput and Control Classification of In Vitro/Ex Vivo Intracellular Delivery.
Tree structure of the three main categories of in vitro/ex vivo intracellular delivery, their subcategories, and specific methods. High throughput, low control methods are shown in yellow; low throughput, high control methods are shown in blue; and high throughput, high control methods are shown in green.

