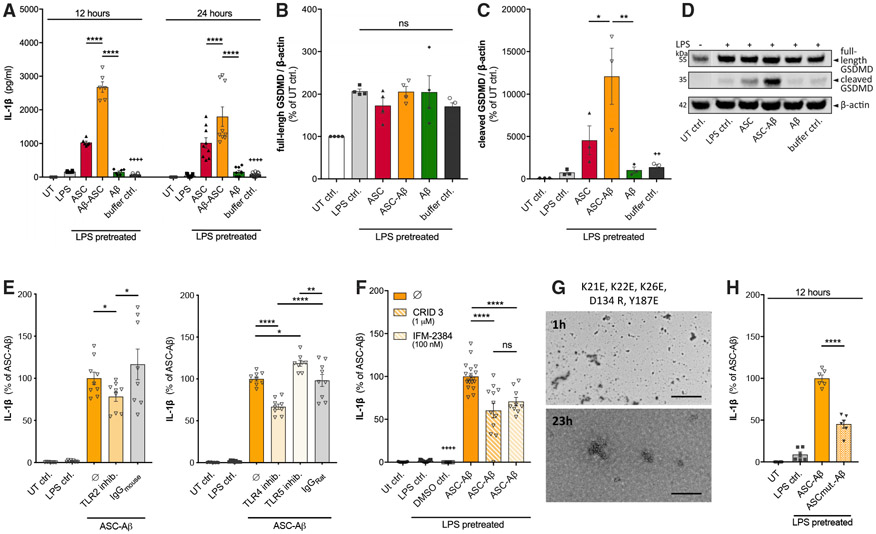
Figure 3. ASC-Aβ Composites Induce IL-1β by TLR2 and TLR4 Ligation, a Process Dependent on ASC’s Fibrillation Ability.
(A) IL-1β levels in conditioned medium of primary microglia after 12 and 24 h of exposure to ASC, Aβ, or ASC-Aβ composites (n = 3 independent experiments with triplicate treatments for all conditions).
(B–D) IB analysis and quantification of full-length Gasdermin D (GSDMD; n = 3; B and D) and cleaved NTD (n = 4; C and D). Empty wells and wells containing experimental samples, which are not part of this study are not displayed. Vertical lines in blots indicate spliced sections (D).
(E) IL-1β levels in conditioned medium of primary microglia treated for 12 h with TLR2-, TLR4-, and TLR5-neutralizing antibodies as well as the respective IgG isotype controls in parallel to stimulation with ASC, Aβ, or ASC-Aβ composites (n = 3 independent experiments with triplicate treatments for all conditions).
(F) IL-1β levels in conditioned medium of primary microglia after NALP3 inflammasome inhibition using CRID3 or IFM-2384 (n = 3 independent experiments with triplicate treatments for all conditions).
(G) EM of ASC carrying PYD (K21E, K22E, and K26E) and CARD (D134R and Y187E) mutations after 1 and 23 h of incubation at 37°C.
(H) IL-1β levels in conditioned medium of primary microglia treated with ASC-Aβ composites or mutated ASC pre-incubated with Aβ (n = 3 independent experiments with duplicate treatments for all conditions).
All graphs are presented as mean ± SEM and were analyzed by two-way ANOVA (A) or one-way ANOVA (B–H) in conjunction with Tukey’s test. Levels of significance are indicated as follows: *p < 0.05, **p < 0.01, ***p < 0.001, ****p < 0.0001. Asterisks indicate significance between groups connected by lines; plus symbol indicate significance between ASC-Aβ composites and volume-equal buffer control-treated groups. Scale bar, 2 μm (G, upper panel) and 200 nm (G, lower panel).
See also Figures S1 and S2.

