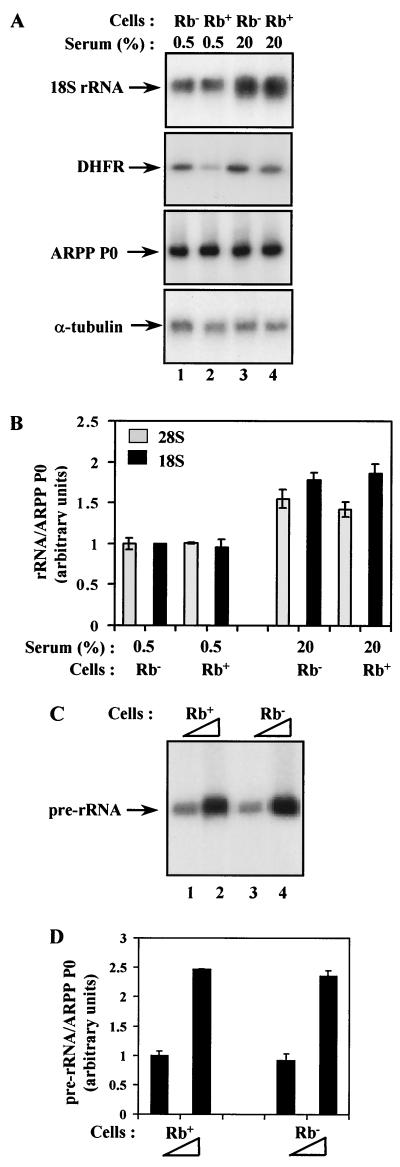
FIG. 1.
Pol I activity is not elevated in fibroblasts from Rb−/− mice. (A) Northern blot analysis of total RNA (10 μg) from Rb−/− (lanes 1 and 3) or Rb+/+ (lanes 2 and 4) fibroblasts that were actively growing in 20% serum (lanes 3 and 4) or made quiescent by culture for 24 h in 0.5% serum (lanes 1 and 2). The upper panel shows the blot probed with an 18S rRNA gene fragment, and the bottom two panels show the same blot, which has been stripped and reprobed with ARPP P0 and α-tubulin gene fragments. In the second panel, the same RNA samples were analyzed by RT-PCR for expression of DHFR mRNA. (B) The 18S rRNA signals were normalized against the ARPP P0 signals, as determined by PhosphorImager, and the mean values from three independent experiments are represented graphically underneath. Data obtained in the same way for 28S rRNA are also presented. (C) Primer extension analysis of 2 μg (lanes 1 and 3) or 5 μg (lanes 2 and 4) of total RNA from Rb+/+ (lanes 1 and 2) or Rb−/− (lanes 3 and 4) fibroblasts that were actively growing in 20% serum. (D) The pre-rRNA signals were normalized against ARPP P0, as determined by PhosphorImager, and the mean values from three independent experiments are represented graphically underneath.

