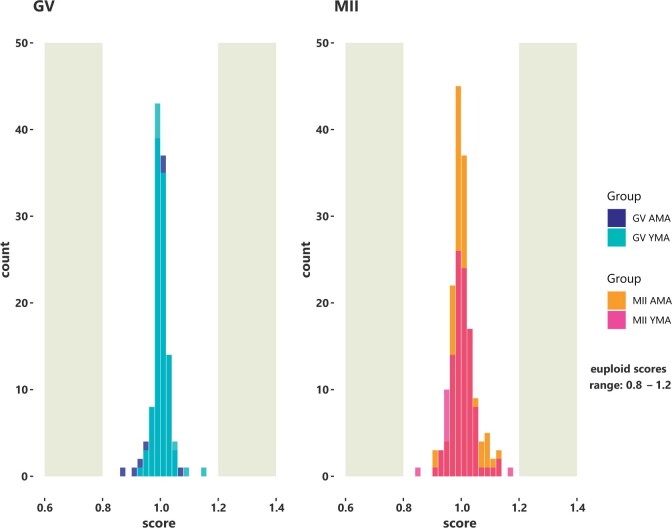
Figure 1.
Bell shaped histograms illustrate the score of the average euploid GV and MII oocytes. Normal scores generated by scploid software range between 0.8 and 1.2 (euploidy status). Based on the allele specific gene expression, a score of 1 indicates that no aneuploid chromosomes were present. The results derived from the RNA sequencing data analysis. AMA, advanced maternal age; GV oocyte, germinal vesicle oocyte; MII oocyte, metaphase II oocyte; YMA, young maternal age.

