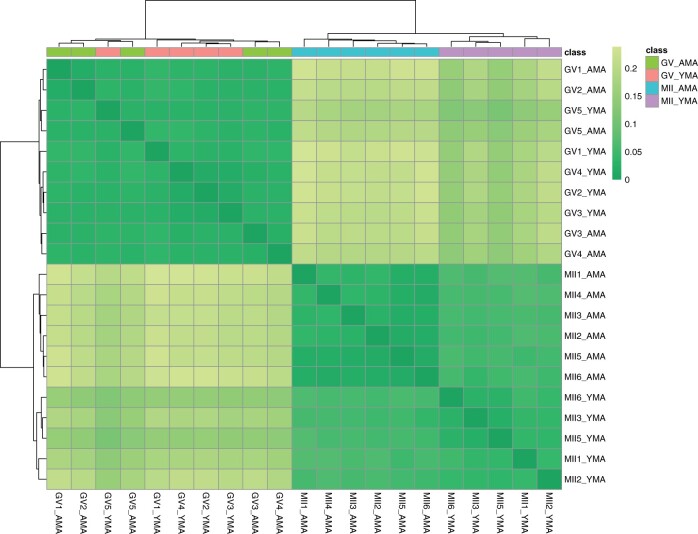
Figure 2.
Heatmap with colours highlighting the distance matrix (Spearman’s correlation). Colour gradient ranges from dark green (minimum distance) to light green. Horizontal bars (on the top of heatmap) represent the maternal age class. Cluster identification is facilitated by the two dendrograms. AMA, advanced maternal age; GV oocyte, germinal vesicle oocyte; MII oocyte, metaphase II oocyte; YMA, young maternal age.

