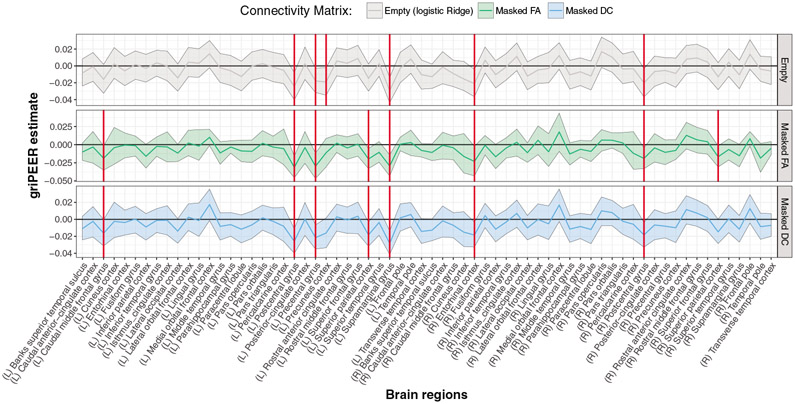
Figure 10:
griPEERboot results in a sample of 162 participants, of whom 108 were HIV-infected. Here, the binary response variable was defined as the disease indicator, and 66 cortical brain regions were considered—33 from each hemisphere. Regions labelled as response related are indicated by red vertical lines. Confidence intervals were calculated based on 50,000 bootstrap samples.

