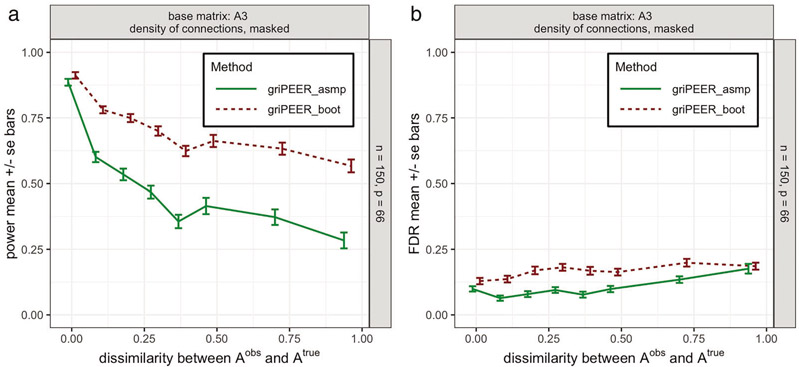
Figure 9:
The estimated values for power (left panel) and FDR (right panel) obtained with an asymptotic variance–covariance matrix-based approach (griPEERasmp, green line) and a bootstrap-based approach (griPEERboot, red line). Values are aggregated (mean) over 100 runs with number of observations n = 150, number of variables p = 66 and (Figure 2, middle right plot) as a true connectivity pattern. The extent of dissimilarity between and is shown on the x-axis. Standard errors of the mean are used.

