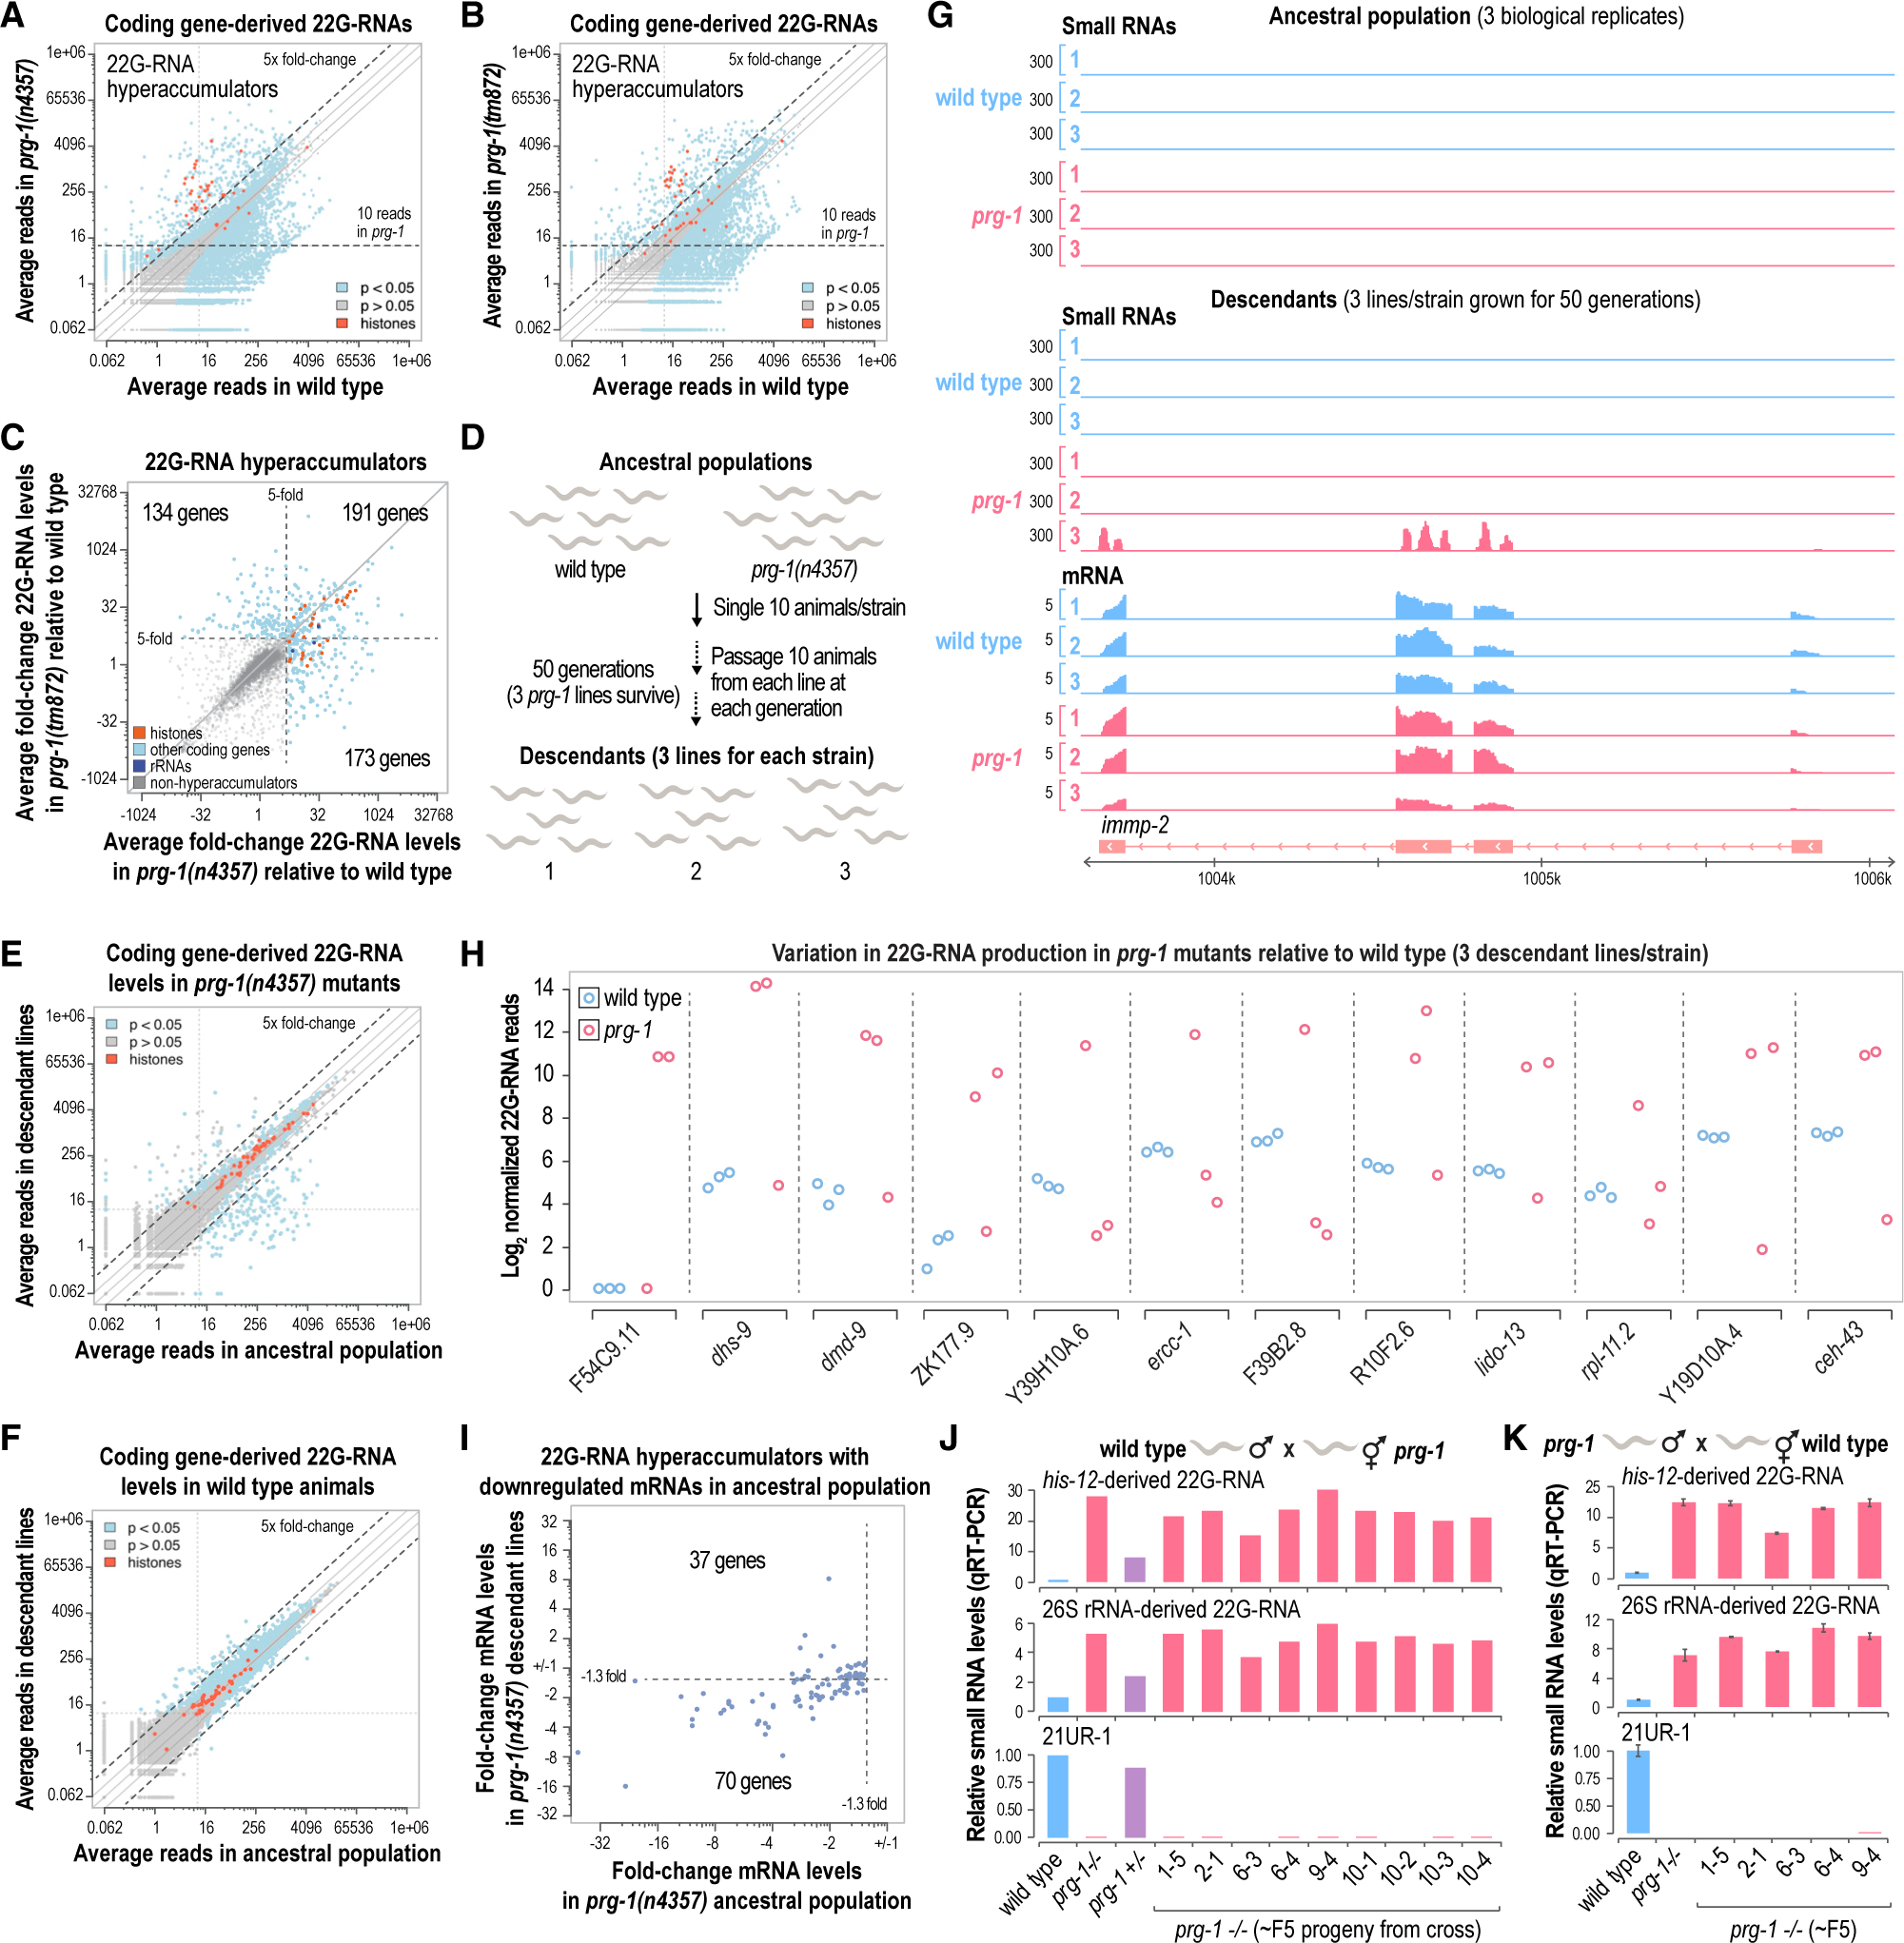
Figure 3. Stochasticity of 22G-RNA production in prg-1 mutants.

(A and B) Scatterplots displaying each gene as a function of normalized log2-transformed small RNA high-throughput sequencing reads in wild-type and prg-1(n4357) (A) or prg-1(tm872) (B) mutants (whole gravid adult animals, n = 3 biological replicates). The values on the axes are reverse transformed to reflect non-transformed values. Solid lines above and below the y = x lines indicate 2 and −2 fold-changes.
(C) Scatterplot displaying each gene classified as a 22G-RNA hyperaccumulator as a function of log2-transformed fold-change 22G-RNA levels in prg-1(n4357) or prg-1(tm872) relative to wild-type (whole gravid adult animals, n = 3). Genes that yielded >10 reads on average in at least one prg-1 mutant strain but that were not classified as hyperaccumulators are shown in gray. The axes reflect non-transformed values. The numbers of genes in each quadrant are shown. Dashed lines mark the 5-fold-change cutoff used to classify hyperaccumulators in the two prg-1 strains.
(D) Schematic illustrating the generational assay used in this study. mut-14(mg464) smut-1(tm1301) and prg-1(n4357); mut-14(mg464) smut-1(tm1301) strains were also included but for simplicity are not shown.
(E and F) Scatterplots displaying each gene as a function of normalized log2-transformed small RNA high-throughput sequencing reads in the ancestral population and descendant lines of prg-1(n4357) mutants (E) or wild-type animals (F) (whole gravid adult animals, n = 3). The axes show non-transformed values.
(G) mRNA and small RNA read distribution across a representative gene locus, immp-2. Three biological replicates or lines are shown for wild-type and prg-1(n4357).
(H) Plots displaying normalized log2-transformed small RNA reads for several genes in each wild-type and prg-1(n4357) mutant line after 50 generations of continuous growth (y axis shows log2-transformed values).
(I) Scatterplot displaying genes classified as 22G-RNA hyperaccumulators that were downregulated at the mRNA level as a function of mRNA fold-change in prg-1 mutants relative to wild-type at generations 1 (ancestral population) and 50 (descendant lines) of continuous growth.
(J and K) Bar plots displaying relative levels of each small RNA in the parental wild-type and prg-1 mutant lines and in the ~F5 progeny of crosses between wild-type males and prg-1(n4357) hermaphrodites (n = 1) (J) and prg-1(n4357) males and wild-type hermaphrodites (n = 2) (K). Error bars in (K) are mean ± SD.
