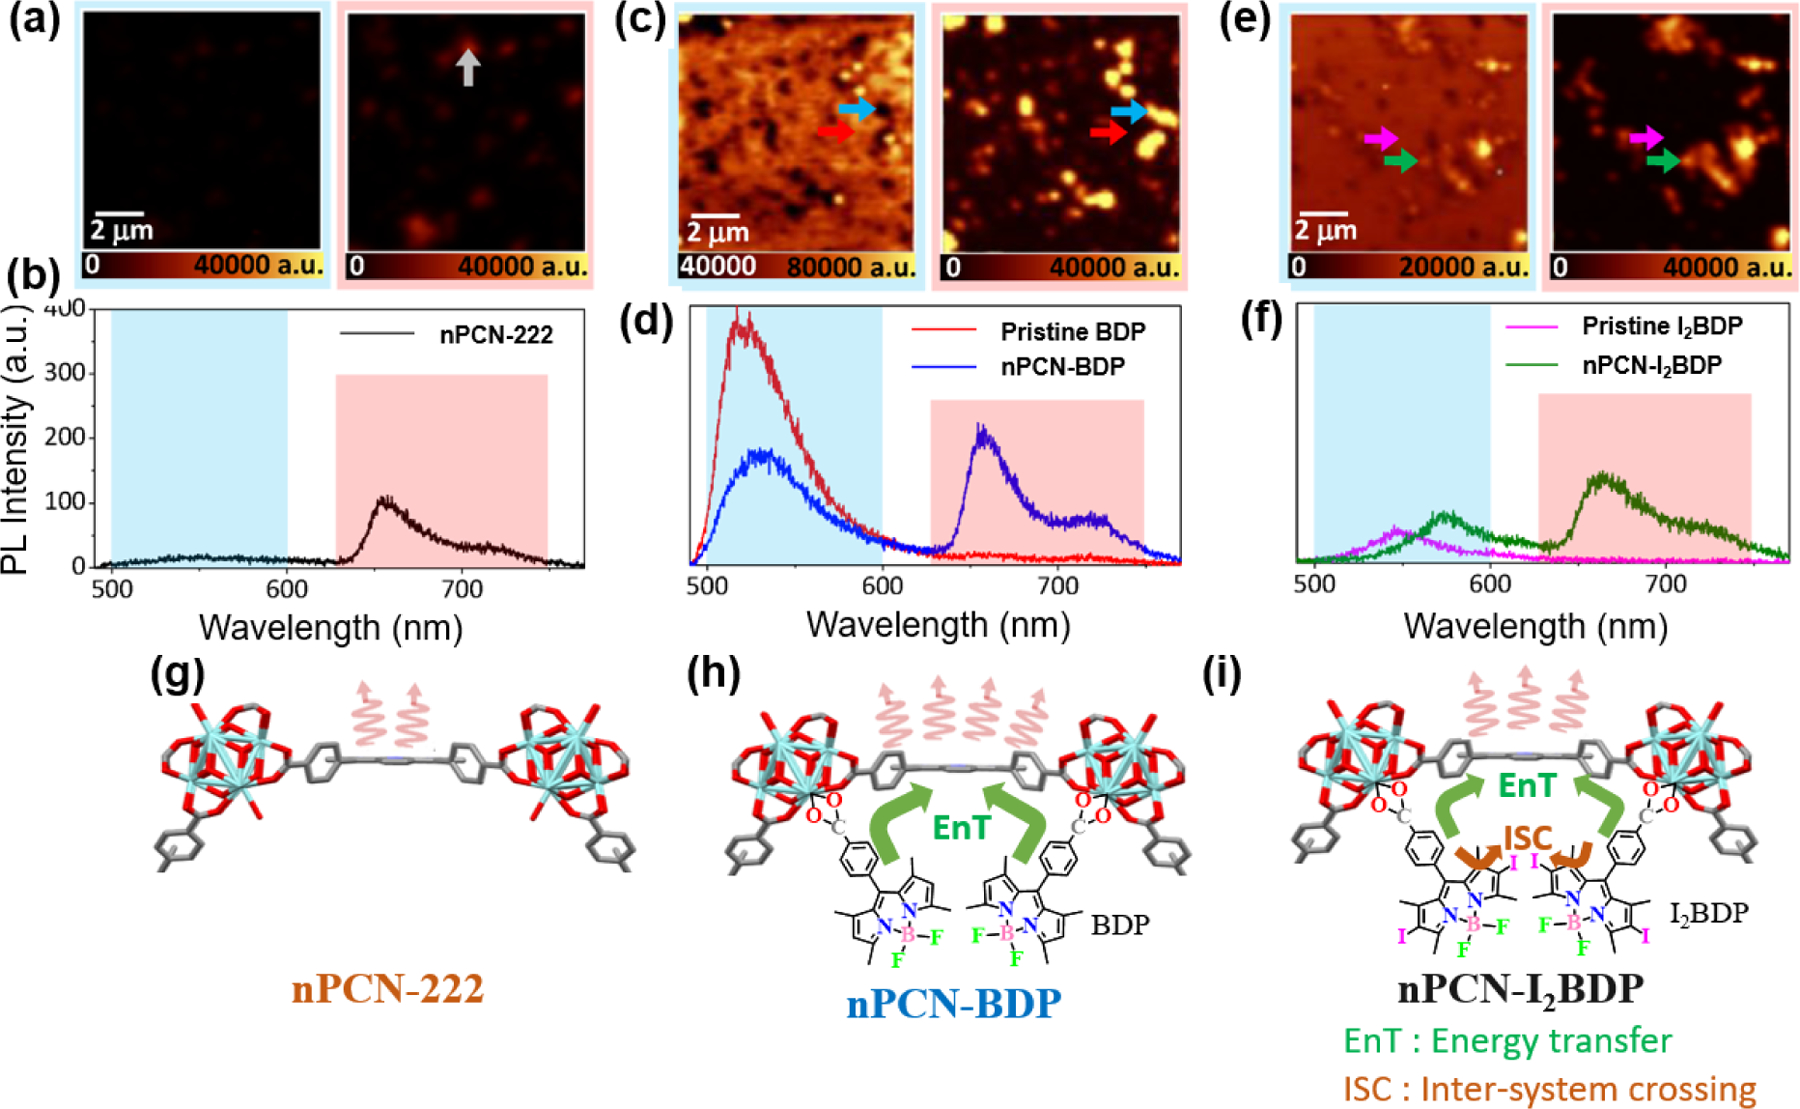
Fig. 30.

(a) Fluorescence maps and representative local fluorescence spectra of (a,b) nPCN-222, (c,d) nPCN-BDP, and (e,f) nPCN-I2BDP samples. The fluorescence maps were obtained by integrating the donor (BODIPY/I2BODIPY) emission range of 500–600 nm (blue box) and acceptor (nPCN-222) emission range of 630–750 nm (red box). In each map, local representative fluorescence spectra were obtained from the location marked by the arrows. (g-i) Expectation of transition pathways of the incorporated MOFs system. (g) Fluorescence emission of nPCN-222. (h) Enhanced fluorescence emission of nPCN-222 (acceptor) induced by resonance energy transfer from BODIPY (donor) in nPCN-BDP. (i) Energy transfer and inter-system crossing can occur in nPCN-I2BDP. Reproduced with permission from ref. [124]. Copyright 2020 MDPI.
