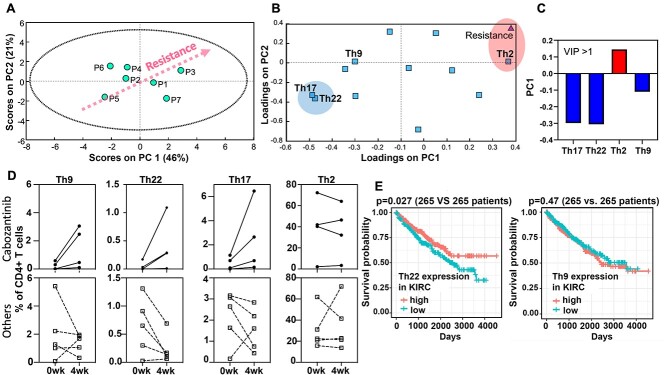
Figure 3.
PLSR analysis of MDSC and T cell subsets and cabozantinib resistance. PBMCs isolated from nine patients with ccRCC undergoing systemic therapy were profiled for MDSC and T cell subtypes using flow cytometry. A PLSR model was generated using flow cytometry data as independent variables and cabozantinib resistance quantified by total tube length from tri-culture angiogenesis assay as a dependent variable. (A) Scores plot separated patients according to the degree of resistance measured in the tri-culture model along the principal component 1 (PC1). (B) Loadings plot shows covariance among the immune cell subtypes with the cabozantinib resistance. (C) VIP of immune cell subtypes with VIP score >1. (D) Changes in Th9, Th17, Th22, and Th2 cells for four patients who are receiving cabozantinib treatment (solid lines) were compared to five patients who are undergoing other therapies (dotted lines, three patients for nivolumab and two patients for pazopanib). (E) Immune gene-signature analysis of 530 patients with ccRCC from TCGA cohort showed that patients with higher expressions of the Th22 gene signature had significantly better overall survival (log-rank test P = 0.027). There was no significant correlation between the Th9 gene signature and overall survival.

