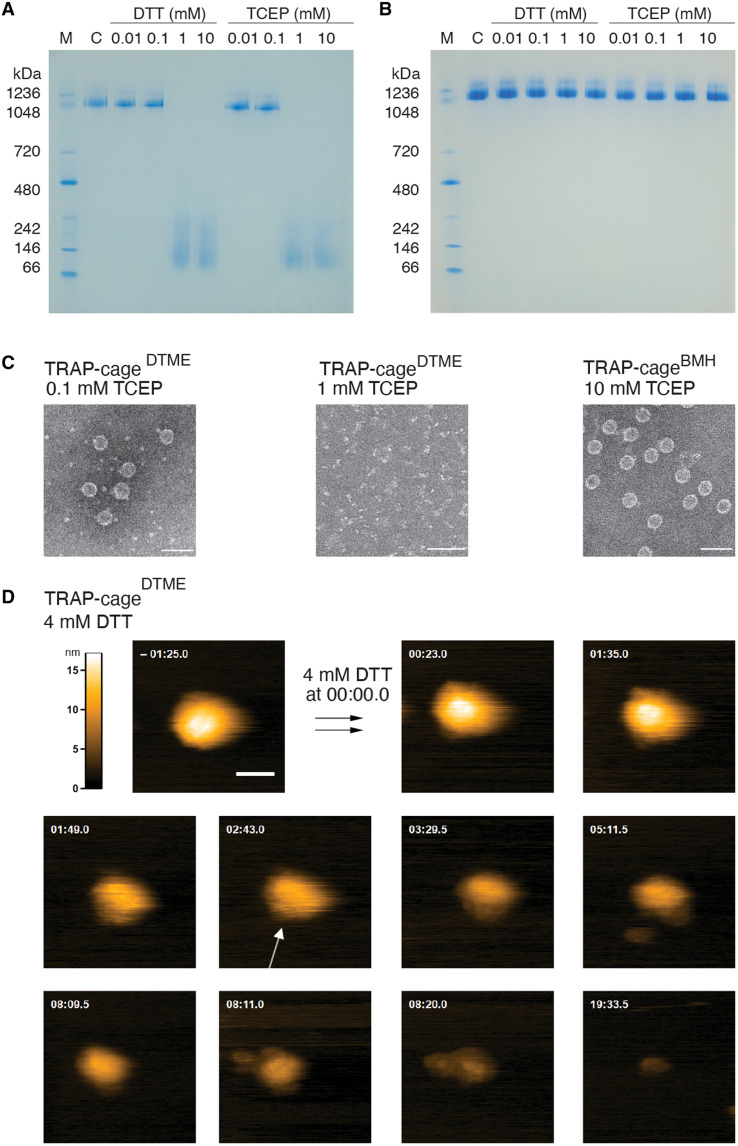
Fig. 2. Redox responsiveness of TRAP-cages.
(A and B) Native polyacrylamide gel electrophoresis (PAGE) analysis of TRAP-cageDTME (A) and TRAP-cageBMH (B) in the presence of DTT and tris(2-carboxyethyl) phosphine (TCEP). “C” in (A) and (B) denote TRAP-cageDTME and TRAP-cageBMH, respectively. M, molecular weight marker. (C) TEM images showing effects of 0.1 mM (left) and 1 mM (middle) TCEP on TRAP-cageDTME and the effect of 10 mM TCEP addition on TRAP-cageBMH (right). Scale bars, 50 nm. (D) Selected frames from a high-speed atomic force microscopy (HS-AFM) movie (movie S1) of TRAP-cageDTME, taken at two frames/s, 200 nm by 200 nm, 200 × 200 pixel, showing the effect of 4 mM DTT addition to TRAP-cageDTME. Time after addition of DTT indicated. A TRAP ring subunit within the TRAP-cage is indicated with a white arrow. Scale bar, 50 nm, in frame t = −01:25.0. Z color scale is set to −1 to 16 nm (lookup table, top left).

