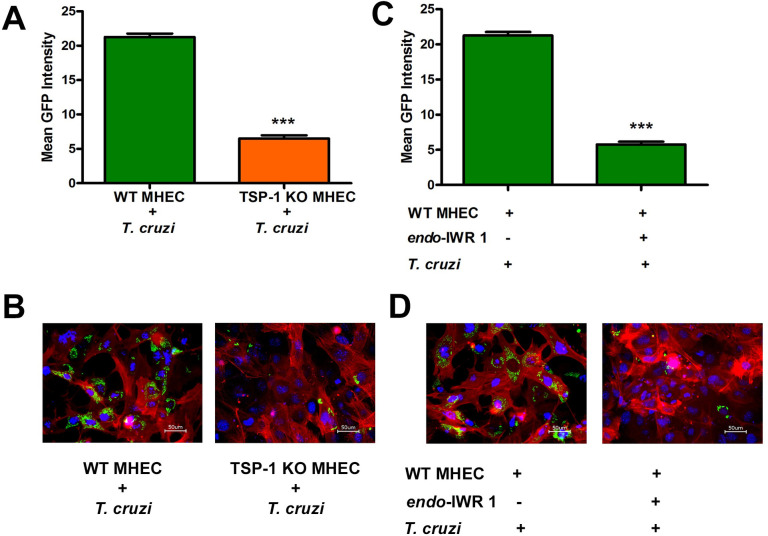
Fig 9. Inhibition of Wnt signaling pathway or absence of TSP1 decreases cellular T. cruzi infection.
(A) WT MHEC and TSP1 KO MHEC seeded in 1% gelatin coated 48-well plates were challenged with transgenic GFP-expressing T. cruzi trypomastigotes, fed with fresh complete media daily for 72 h. Infected and control cells were washed with 1X DPBS and GFP fluorescence intensities were recorded, emission 485/20 and excitation 528/20 using microplate reader (BioTek SYNERGY, SOTWARE Gen5 version 2.05). The mean fluorescence intensities of each replicate compared to control were computed and plotted. (B) WT MHEC and TSP1 KO MHEC were seeded on 1% gelatin in 6-well culture plates and challenged with the transgenic GFP-expressing T. cruzi trypomastigotes. Cells were fed with fresh complete media daily for 72 h. NucBlue Live ReadyProbes Reagent was used to stain the nuclei and CellMask Orange Actin Tracking Stain was used to stain actin. The stained cells were visualized using the Keyence All-in-One Fluorescence Microscope BZ-X710 and analyzed with BZ-X Analyzer software. (C) WT MHEC and TSP1 KO MHEC seeded in 1% gelatin coated 48-well plates were preincubated with or without 20 μM endo-IWR1 for 72 h and challenged with transgenic GFP-expressing T. cruzi trypomastigotes for 72 h with daily medium change. Infected and control cells were washed with 1X DPBS and GFP fluorescence intensities were recorded, emission 485/20 and excitation 528/20 using microplate reader (BioTek SYNERGY, SOTWARE Gen5 version 2.05). The mean fluorescence intensities of each replicate compared to control were computed and plotted. (D) WT MHEC and TSP1 KO MHEC seeded on 1% gelatin coated 6-well plates were preincubated with or without 20 μM endo-IWR1 for 72 h and challenged with transgenic GFP-expressing T. cruzi trypomastigotes for 72 h with daily media change. NucBlue Live ReadyProbes Reagent was used to stain the nuclei and CellMask Orange Actin Tracking Stain was used to stain actin. The stained cells were visualized using the Keyence All-in-One Fluorescence Microscope BZ-X710 and analyzed with BZ-X Analyzer software. The value of P< 0.05 was considered significant. *P< 0.05; **P< 0.01; ***P< 0.001.

