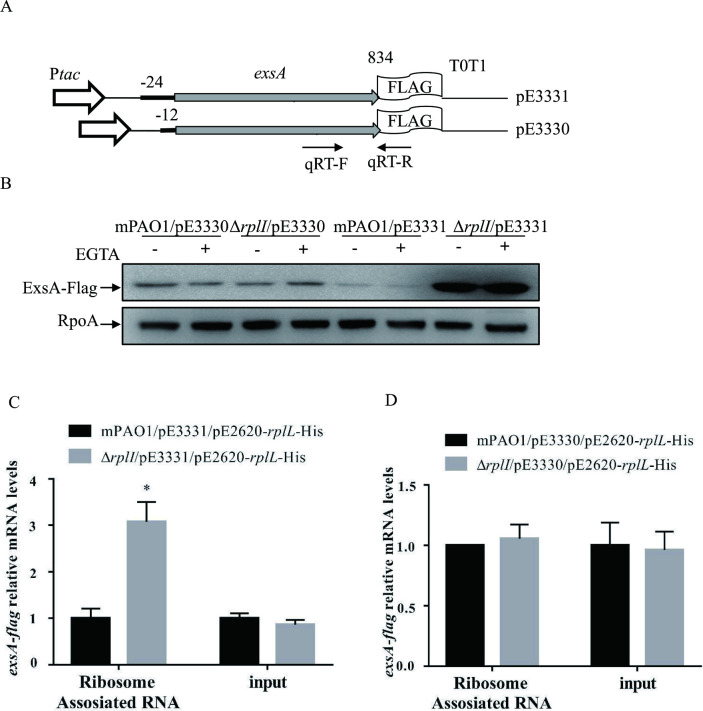
Fig 5. Expression of ExsA-Flag and quantification of ribosome-associated exsA mRNAs.
(A) Constructs of Ptac-24 bp-exsA-Flag-T0T1 (pE3331) and Ptac-12 bp-exsA-Flag-T0T1 (pE3330). The positions of qPCR primers are represented by arrows. (B) The protein levels of ExsA-Flag in the indicated strains. mPAO1 and ΔrplI containing pE3330 or pE3331 were grown to an OD600 of 1.0 in LB with (+) or without (-) 5 mM EGTA and collected by centrifugation. Samples from equivalent numbers of bacterial cells were loaded onto an SDS-PAGE gel and probed with an anti-Flag or an anti-RpoA antibody. The data shown represent the results from three independent experiments. (C and D) mPAO1 and ΔrplI containing pE2620-rplL-His and pE3331 (C) or pE3330 (D) were lysed with sonication and subjected to Ni-NTA chromatography or not (input), followed by RNA purification. The relative mRNA levels of exsA-Flag were determined by real-time qPCR with 16S ribosome RNA (PA0668.1) as the internal control. *, P < 0.05 by Student’s t test.

