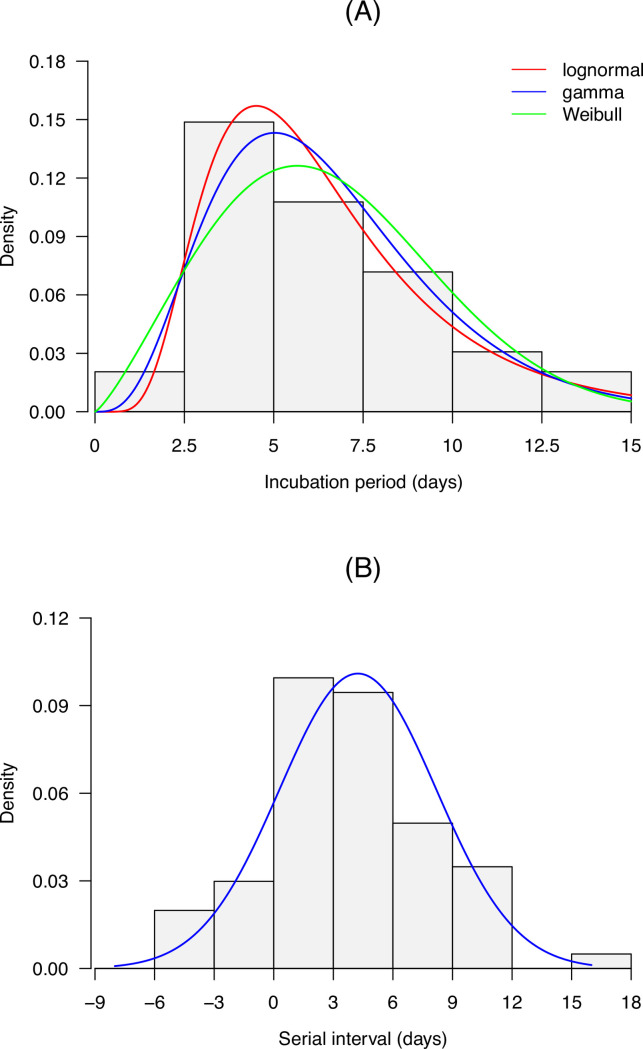
Fig 3. Incubation period and serial interval distributions of the SARS-CoV-2 Delta variant in Guangzhou, China.
The blue lines represent the estimated distribution densities. Data of 78 cases and 67 transmission pairs were used to estimate the incubation period and serial interval distributions, respectively.

