
Figure 3: Trans-ancestry LDL-C PRS show similar performance across ancestry groups.
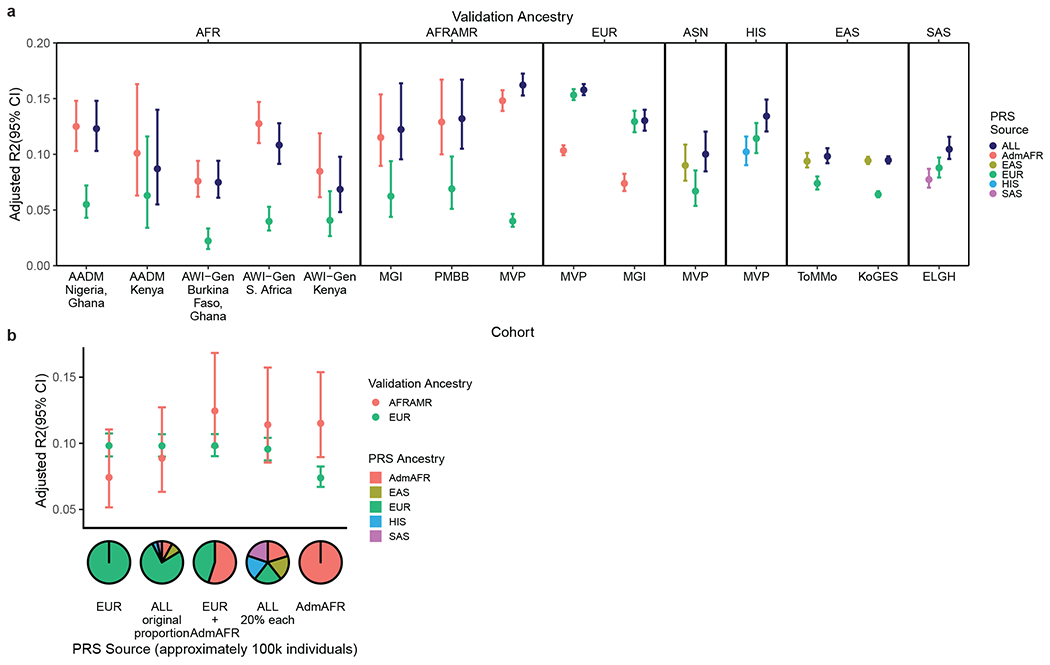
a) Polygenic scores generated from trans-ancestry meta-analysis show equivalent or better performance across most ancestry groups relative to ancestry-specific PRS within each cohort, whereas European ancestry-specific scores show less transferability. Adjusted R2 is calculated with the risk score as a predictor of LDL-C in a linear model with covariates. AFR: African, AFRAMR: African American, ASN: Asian American b) Trans-ancestry scores derived from equal proportions of each ancestry group predict LDL-C better for African Americans in MGI than predominantly European ancestry scores at constant sample size. Error bars depict 95% confidence intervals. Sample sizes for each cohort are provided in Supplementary Table 16.