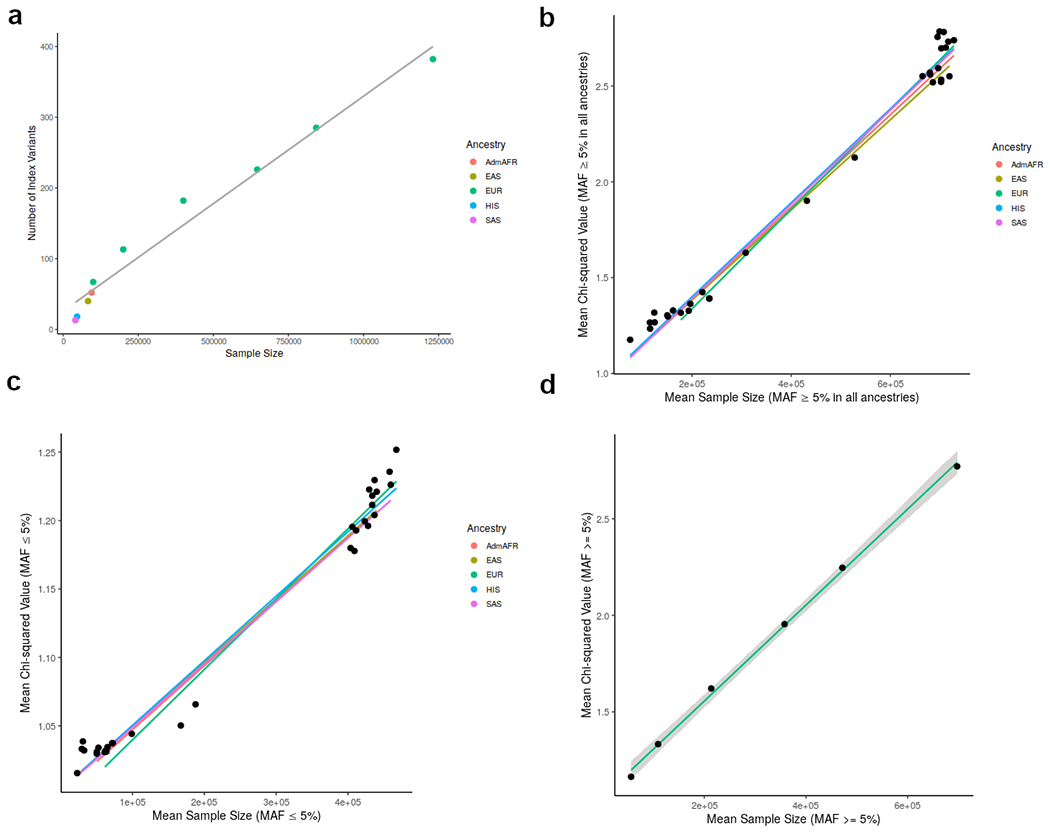
Extended Data Figure 2: Comparison of the number of index variants by sample size.

a) Comparison of the number of index variants reaching genome-wide significance (p < 5x10⁻⁸) from meta-analysis of LDL-C in each ancestry group. A meta-analysis of five random subsets of European cohorts selected to reach sample sizes of approximately 100,000, 200,000, 400,000, 600,000, or 800,000 individuals is also shown.
b) Comparison of chi-squared values from meta-analysis of LDL-C for each possible combination of ancestry groups (without genomic-control correction) for variants with minor allele frequency (MAF) ≥ 5%. The colored lines indicate a linear regression model of all meta-analyses for a specific ancestry (eg. all analyses including European individuals).
c) Comparison of chi-squared values from meta-analysis of LDL-C for variants with MAF ≤ 5%.
d) Comparison of chi-squared valued for variants with MAF ≥ 5% for LDL-C without genomic-control correction in a meta-analysis of all European cohorts as well as five subsets selected to reach sample sizes of approximately 100,000, 200,000, 400,000, 600,000, or 800,000 individuals.
