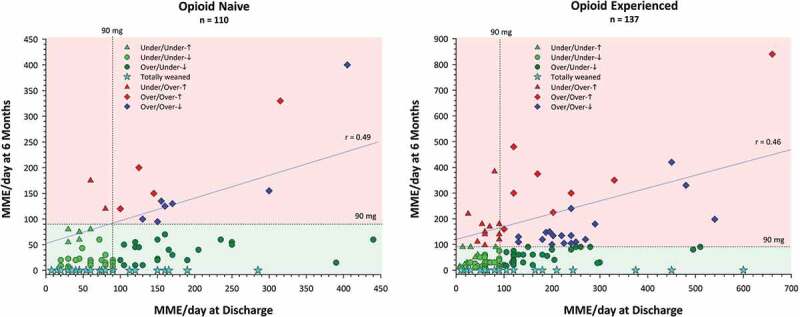
Figure 1.

Mean daily opioid use in daily morphine milligram equivalents (MME/day) at the end of TPS treatment shown as a function of daily morphine milligram equivalents at hospital discharge (i.e., prior to TPS treatment) for opioid-naïve and opioid-experienced patients. Also shown is the 90 MME/day maximum dose recommended by the U.S.69 and Canadian70 opioid guidelines (dashed lines). Based on the 90 MME/day, patients in the two lower quadrants (green shading) represent treatment successes and those in the two upper quadrants (red shading) represent treatment failures. Green triangles represent patients who were under 90 MME/day on both occasions and higher at 6 months than at hospital discharge; green circles represent patients who were under 90 MME/day on both occasions and lower at 6 months than at hospital discharge; dark green circles represent patients who were over 90 MME/day at hospital discharge and under at 6 months; cyan stars represent patients who were totally weaned (MME/day = 0) by 6 months; red triangles represent patients who were under 90 MME/day at hospital discharge and over at 6 months; red diamonds represent patients who were over 90 MME/day on both occasions and higher at 6 months than at hospital discharge; blue diamonds represent patients who were over 90 MME/day on both occasions and lower at 6 months than at hospital discharge. Left panel adapted with permission from Clarke et al.65.
