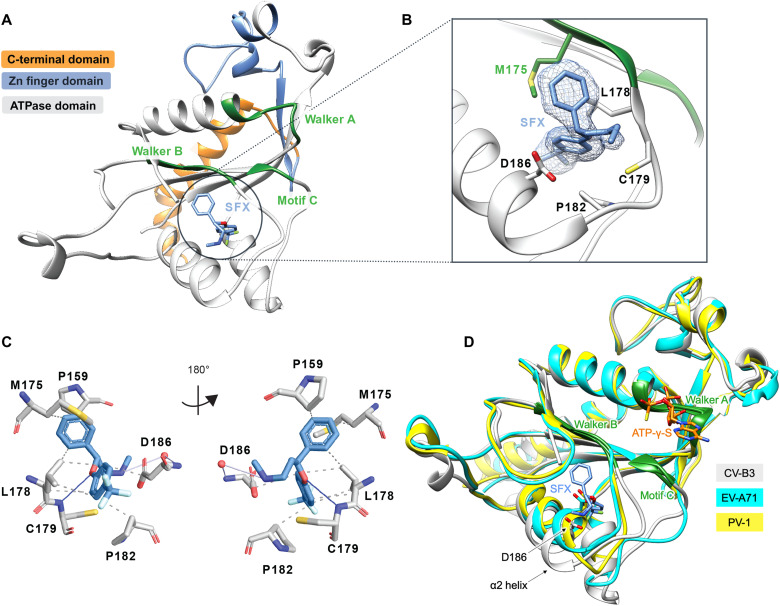
Fig. 1. Crystal structure of CV-B3 Δ116-2C in complex with SFX.
(A) The C-terminal part of 2C is highlighted in orange. The zinc finger domain is highlighted in blue, and the ATPase domain is highlighted in gray. Within the ATPase domain, the catalytic center, comprising Walker A, Walker B, and motif C, is highlighted in green. SFX is located close to the Walker B domain and is colored blue. (B) Zoomed-in view of the SFX binding pocket showing the interacting residues and electron density for the bound drug. Green residues are part of the Walker B motif. (C) Protein-ligand interaction profile of SFX with the 2C residues. Hydrophobic interactions are shown as dashed lines (P159, M175, L178, P182, and D186). Hydrogen bonds are shown as blue lines (C179), and water-mediated hydrogen bonds are colored light blue (D186). Figure was generated using PLIP (60). (D) Overlay of the 2C crystal structure of CV-B3 (gray) with the 2C crystal structure of PV-1 (PDB: 5Z3Q, chain A) (yellow) and EV-A71 (PDB: 5GRB, chain A) (cyan) in complex with ATP-γ-S.

