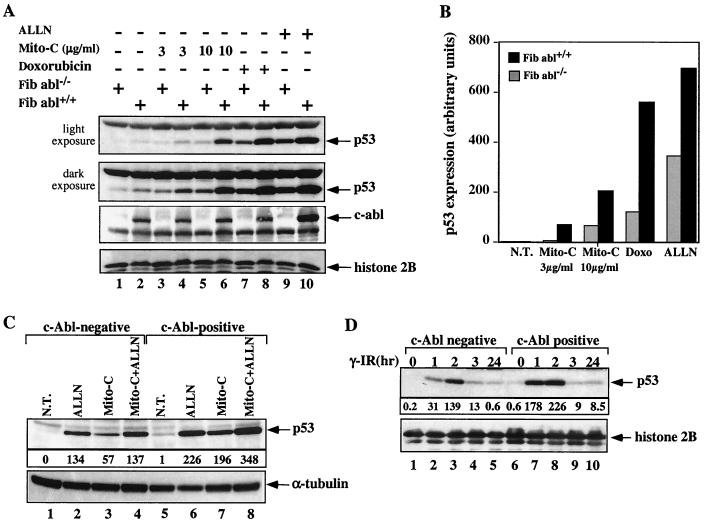
FIG. 1.
c-Abl enhances the accumulation of endogenous p53 in response to DNA damage. (A) MEFs from a c-abl null mouse (Fib abl−/−) or from a normal mouse (Fib abl+/+) were either untreated (lanes 1 and 2) or treated as indicated. Cells were incubated with ALLN (150 μM) for 4 h prior to harvest or were treated with mitomycin C (Mito-C) at the indicated concentrations for 6 h or with doxorubicin at 3 μg/ml for 6 h. At the end of the treatment, cell extracts were subjected to Western blot analysis using anti-p53 antibodies (PAb248 and PAb421). Two exposures of the enhanced chemiluminescence-treated blot showing p53 are presented in order to reveal the levels of basal and activated p53. The same membrane was reprobed with anti-c-Abl, and the amounts of protein loaded were monitored by reprobing with anti-histone 2B. (B) The intensity of the bands obtained in the light exposure was quantified by densitometry and the values are plotted on the graph. N. T., no treatment; Doxo, doxorubicin. (C) Fibroblasts null for c-Abl (c-Abl negative) and fibroblasts reconstituted with c-Abl (c-Abl positive) were either not treated (N.T.), incubated with ALLN (150 μM) for 4 h before harvest, treated with mitomycin C (Mito-C) (3 μg/ml) for 6 h, or subjected to both treatments together. At the end of the treatment, cell extracts were subjected to Western blot analysis using anti-p53 antibodies (PAb248 and PAb421). The intensities of the p53 bands were quantified by densitometry and are presented in arbitrary units. The amounts of protein loaded were monitored by reprobing with anti-α-tubulin. (D) Fibroblasts null for c-Abl (c-Abl negative) or reconstituted with c-Abl (c-Abl positive) were either untreated (lanes 1 and 6) or exposed to γ-irradiation (γ-IR) for the periods indicated. The intensity of the bands was quantified as in panel B. The protein levels were determined as for panel C.

