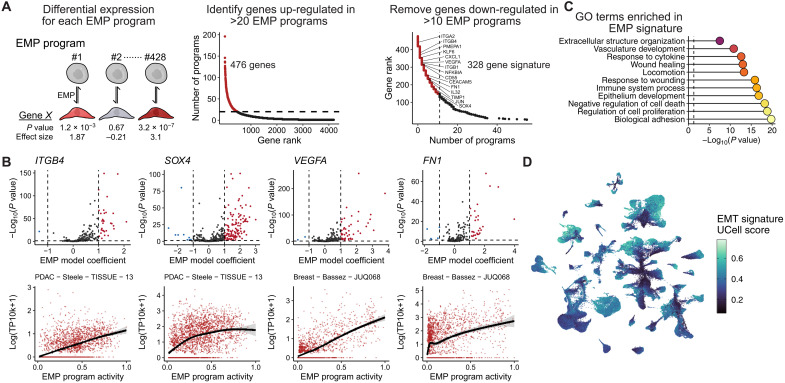
Fig. 2. Defining a conserved EMP gene signature.
(A) Schematic showing the strategy for defining a signature of genes most frequently associated with the 428 identified EMP signatures. (B) EMP-associated GO terms significantly enriched in the 289 conserved EMP genes. P values were calculated using Fisher’s exact tests and adjusted using the Benjamini-Hochberg method. (C) Examples of EMP associated genes. Top plots show the distribution of effect sizes (model coefficients) for each gene with all EMP programs. Dashed line represents the mean value. The horizontal dashed line represents a Benjamini-Hochberg adjusted P value of 0.05. (D) UMAP embedding of malignant cells from the 266 tumors analyzed, colored by a gene set score for the signature of 289 EMP-associated genes.

