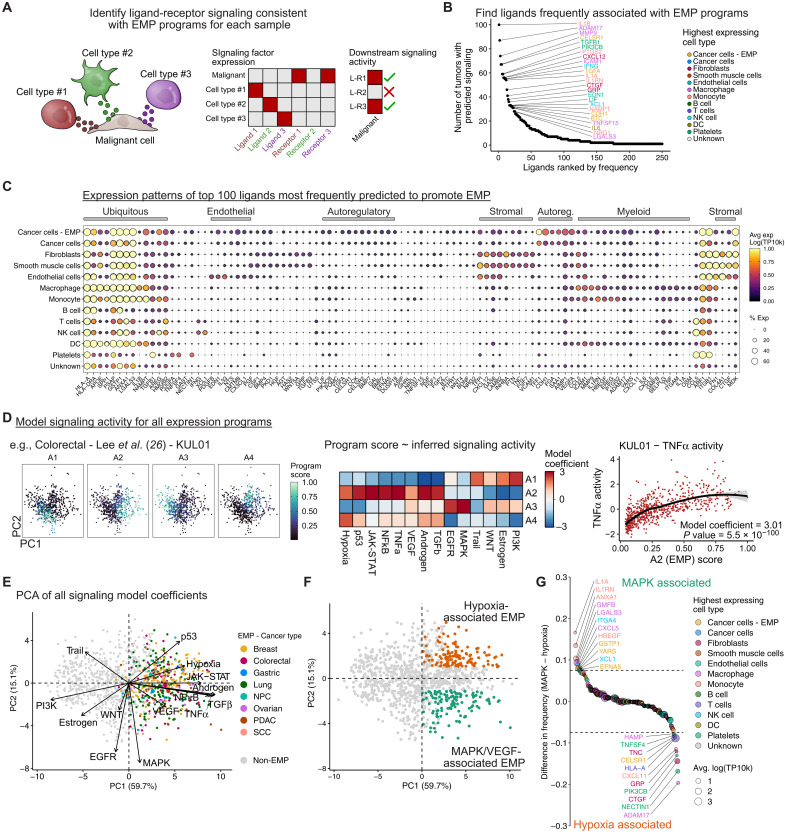
Fig. 4. Signaling networks regulating EMP in cancer.
(A) Schematic showing the identification of ligands that may contribute to EMP. Expression patterns of ligands and their cognate receptors are assessed across all cell types. Putative regulatory ligands are identified if malignant cells express a matching receptor and if the sample’s EMP program is consistent with downstream signaling related to that ligand. (B) Potential ligands from the TME regulating EMP. Ligands were ranked by the number of tumors in which they were predicted to promote EMP programs. (C) Expression of the top 100 ligands in cell types of the TME. The gene order is based on hierarchical clustering and manually annotated. Expression values (log-transformed and scaled UMI counts) were averaged across all 266 tumors. (D) Schematic showing the inference of signaling pathway activity associated with EMP programs. Signaling activity scores are inferred for each individual cell using PROGENy, and each archetype score for a given tumor is then modeled as a function of signaling activity using a linear model. (E) Principal components analysis (PCA) of the signaling model coefficients for all archetype programs. Each point represents an archetype program with EMP programs colored by the cancer type they are associated with. Loading vectors for each of the 14 signaling pathways are shown. (F) Sample as (E) but colored to define hypoxia/p53 (orange) and MAPK/VEGF-associated (green) EMP programs. These were defined as programs having PC1 > 0 and either PC2 > 1 (hypoxia) or PC2 ≤ 1 (MAPK/VEGF). (G) Ligands with preferential associations with MAPK/VEGF- or hypoxia/p53-associated EMP. Values represent the difference in the proportion of programs in which each ligand was implicated.

