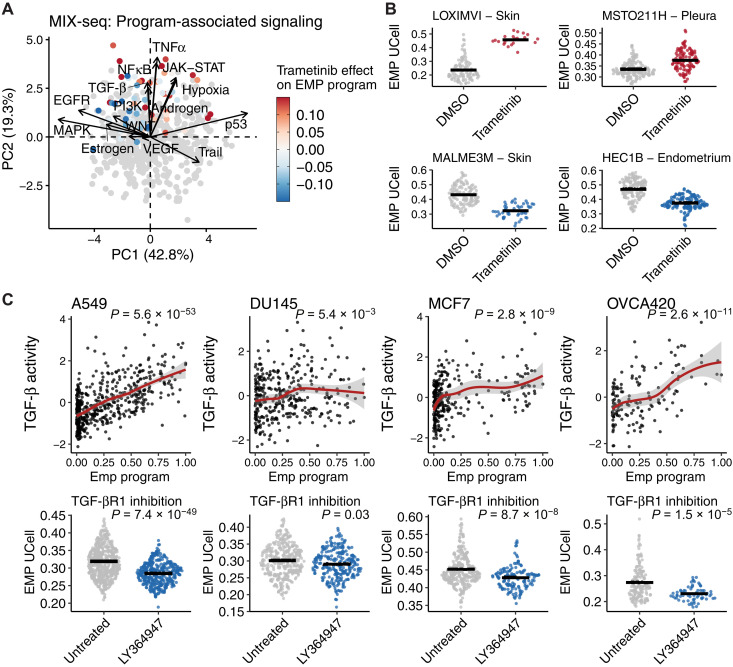
Fig. 6. Regulatory predictions can infer strategies to therapeutically restrict EMP.
(A) PCA of signaling model coefficients for all archetype programs of the 99 cell lines in the MIX-seq dataset. Gray dots represent programs not associated with EMP. EMP programs are colored by the effect trametinib has on its activity. (B) Examples of cell lines whose specific EMP program is enhanced (top) or limited (bottom) by trametinib. DMSO, dimethyl sulfoxide. (C) Effect of LY364947-mediated TGF-βR1 inhibition on sample-specific EMP programs in A549, DU145, MCF7, and OVCA420 cell lines. P values were calculated from linear models for each condition and were all corrected with the Benjamini-Hochberg method.

