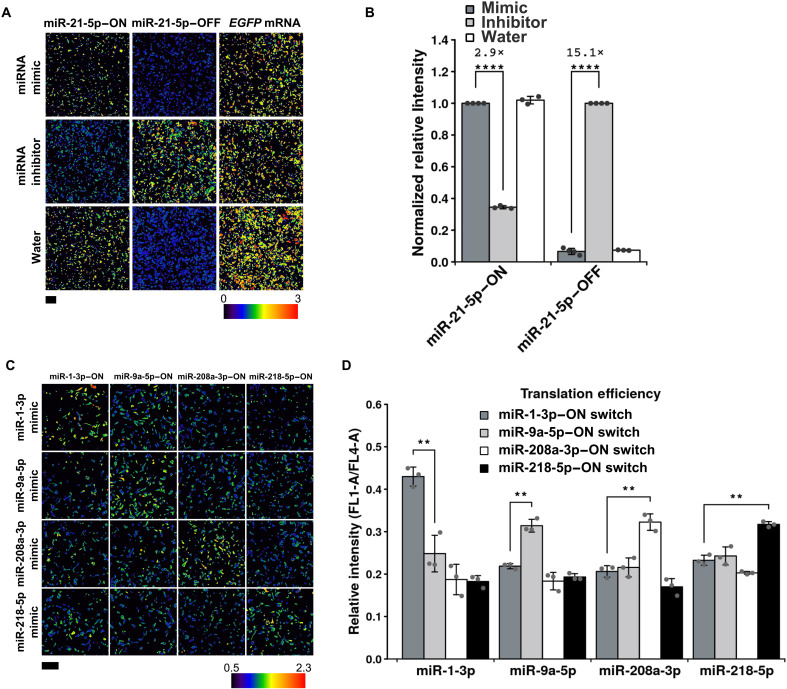
Fig. 3. Response of miRNA-ON switches to various mimics and inhibitors.
(A) Ratiometric images of HeLa cells cotransfected with miR-21-5p–ON and -OFF switches and a mimic/inhibitor of miR-21-5p. The EGFP intensity at each pixel in a cell was calculated using the same method as Fig. 2B. miR-21-5p–ON and –OFF indicate miR-21-5p–ON and -OFF switches, respectively. “EGFP mRNA” indicates mRNA encoding for EGFP without the anti–miR-21-5p sequence. (B) Normalized relative intensity (EGFP/iRFP670) of the miR-21-5p–ON and -OFF switches with miR-21-5p mimic or inhibitor. The relative intensities of ON and OFF switches were normalized by the value without either water and inhibitor, respectively. Error bars represent the means ± SD (n ≥ 3). Outliers were removed by Grubbs test. Data of each biological replicate are shown as a point. ****P < 0.0005. (C) Ratiometric images of HeLa cells cotransfected with various miRNA mimics and their ON switches. The EGFP intensity at each pixel in a cell was calculated using the same method as in Fig. 2B. The columns indicate each miRNA-ON switch, and rows indicate miRNA mimics. (D) Relative intensity (EGFP/iRFP670) of various miRNA-ON switches with mimics. Error bars represent the means ± SD (n = 3). Data of each biological replicate are shown as a point. **P < 0.01.

