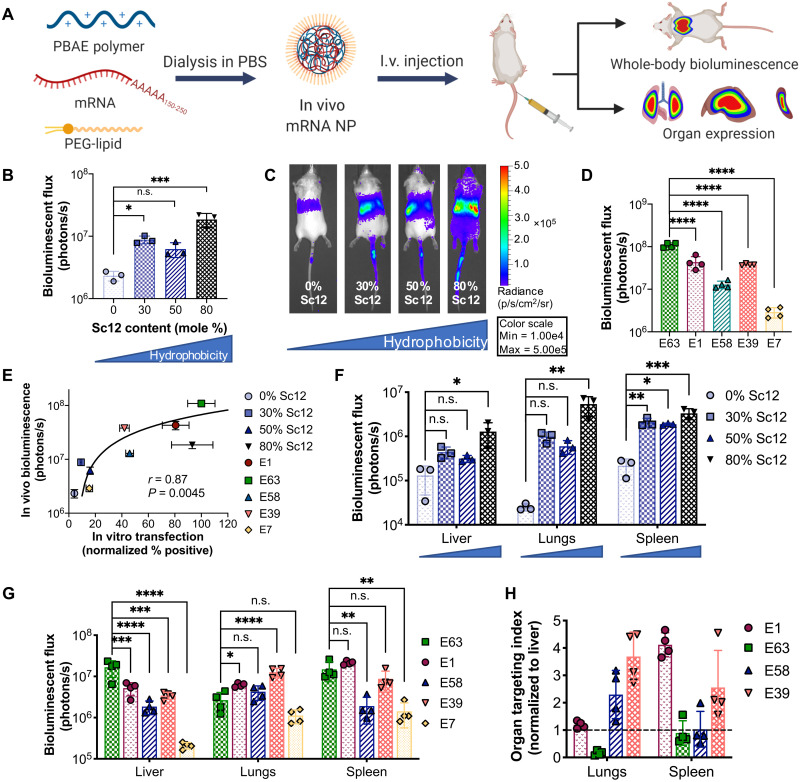
Fig. 5. In vivo validation of PEG-coated PBAE NPs delivering mRNA.
(A) Schematic depicting the experimental workflow. PBAE polymers were dialyzed with fLuc mRNA and the PEG-lipid DMG-PEG2k in PBS to form PEG-coated mRNA NPs, which were administered intravenously (I.v.). fLuc expression was assessed 24 hours after NP injection. (B) Whole-body bioluminescence was assessed for NPs formulated with PBAEs with differential backbone hydrophobicity and (C) representative IVIS images (N = 3). (D) Whole-body bioluminescence quantification for NPs formulated with 50%-Sc12 PBAEs with different end groups (N = 4). (E) In vivo transfection efficacy [from (B) and (D)] was plotted against in vitro transfection in B16 cells. Spearman’s correlation was used to measure the strength of association between the two variables. Organ bioluminescence in the most highly expressing organs when varying (F) polymer backbone hydrophobicity (blue triangles below organ labels indicate increasing backbone hydrophobicity) and (G) polymer end-group structure. Statistical significance was determined using one-way ANOVA with Dunnett’s post hoc analysis comparing against the least hydrophobic polymer (0% Sc12) in (B) and (F) and against end-group E63 in (D) and (G). *P < 0.05, **P < 0.01, ***P < 0.001, and ****P < 0.0001. (H) The organ targeting index as calculated by normalizing bioluminescent flux in each nonliver organ against that of the liver was calculated for the lungs and spleen in high-expressing polymers of the polymer end-group variation series (E7 was excluded because of minimal expression observed). Dotted black line indicates liver expression level. N = 4. Data are means ± SD in all bar graphs.

