Fig. 3.
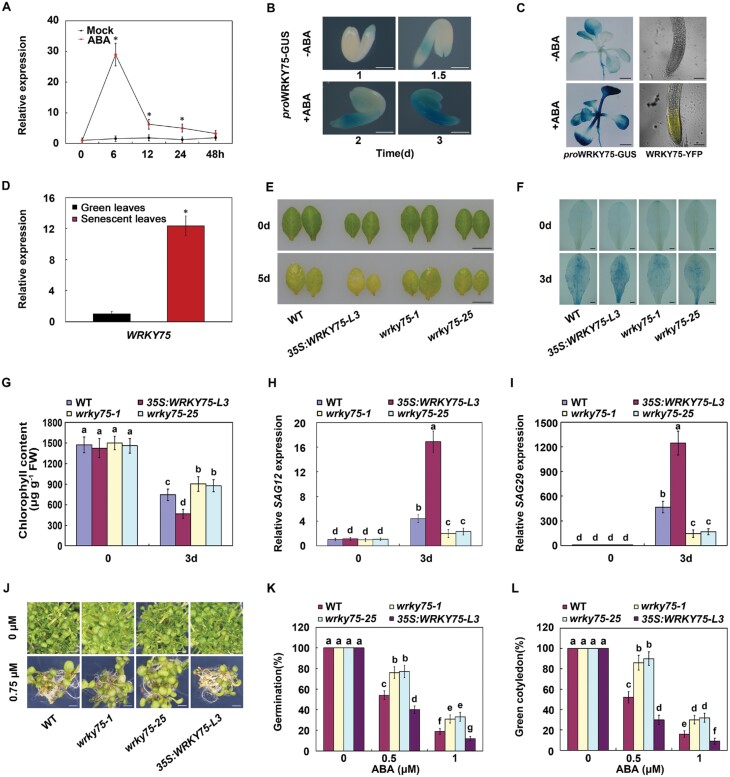
WRKY75 positively regulates ABA-induced leaf senescence and seed germination. (A) qRT–PCR analysis of WRKY75 transcript levels in 4-week-old WT leaves upon 100 µM ABA treatment . Transcript levels of WRKY75 in untreated leaves were arbitrarily set to 1. ACTIN2 and UBQ5 were used as internal controls. Error bars represent ±SD from three independent biological replicates. *P<0.05, Student’s t-test compared with mock treatment. (B) GUS expression in WRKY75p:GUS transgenic seedlings grown on half-strength MS medium at the indicated times, treated with or without 100 µM ABA. Scale bar =200 µm. (C) Left: GUS staining of 10-d-old WRKY75p:GUS seedlings treated with or without 100 µM ABA for 2 h. Scale bar=1mm; Right: YFP detection of WRKY75 in 5-d-old WRKY75:YFP-WRKY75:3’-WRKY75 seedlings treated with or without ABA for 2 h. Scale bar =100 µm. (D) qRT–PCR analysis of WRKY75 transcript levels in 24-day-old non-senescent and 40-day-old senescent leaves. Transcript levels of WRKY75 in non-senescent leaves were arbitrarily set to 1. ACTIN2and UBQ5 were used as internal controls. Error bars represent ±SD from three independent biological replicates.*P<0.05, Student’s t-test compared with green leaves. (E)Senescence phenotypes of the 4-week-old leaves of the indicated genotypes treated with or without 100 µM ABA for 4 d. Scale bar =1 cm. (F) Trypan blue staining of the indicated genotypes treated with or without ABA for 3 d. Scale bar =2 mm. (G) Chlorophyll content in the indicated genotypes. (H, I) qRT–PCR analysis of SAG12 and SAG29 transcript levels in the indicated genotypes. Transcript levels of WRKY75 in control WT leaves were arbitrarily set to 1. ACTIN2 and UBQ5 were used as internal controls. (J) Phenotypes of the indicated genotypes on half-strength MS medium with 0 or 0.75 µM ABA for 7 d. Scale bar =2 mm. (K) Germination rates of the indicated genotypes on half-strength MS medium with 0, 0.5, or 1 µM ABA treatment for 2 d. (L) Greening rates of the indicated genotypes on half-strength MS medium with 0, 0.5, or 1 µM ABA for 6 d. For G-I, K, and L, error bars represent ±SD from three independent biological replicates. Bars with different letters are significantly different from each other (ANOVA; P<0.05).

