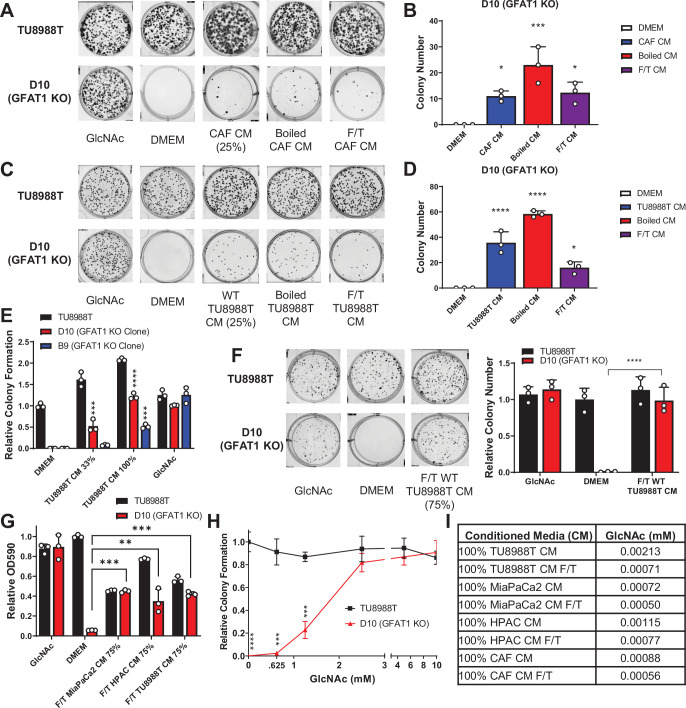
Figure 2. Conditioned media (CM) from cancer-associated fibroblasts (CAFs) and wild-type pancreatic ductal adenocarcinoma (PDA) cells support proliferation of GFAT1 knockout cells.
(A) Representative wells from a colony-forming assay in parental TU8988T and GFAT1 knockout clonal line D10 in 10 mM N-acetyl-glucosamine (GlcNAc), base media (DMEM), or base media supplemented 1:3 (25%) with CAF CM, boiled CAF CM, or CAF CM subject to freeze-thaw (F/T). (B) Quantitation of colonies from data in A (n = 3). (C) Representative wells from a colony-forming assay in parental TU8988T and GFAT1 knockout clonal line D10 in 10 mM GlcNAc, DMEM, or base media supplemented 1:3 (25%) with CM from wildtype TU8988T cells, boiled TU8988T CM, or TU8988T CM subject to F/T. (D) Quantitation of colonies from data in C (n = 3). (E) Quantitation of colony-forming assay data of parental and GFAT1 knockout clonal TU8988T lines in base media, positive control GlcNAc, wildtype TU8988T CM diluted 1:2 (33%) or used directly (100%) (n = 3). (F) Representative wells and quantitation of colony-forming assay data of parental and GFAT1 knockout clonal TU8988T lines in base media, positive control GlcNAc, and wildtype TU8988T CM subject to F/T and diluted 3:1 (75%) (n = 3). (G) Quantitation of colony-forming assay data of parental and GFAT1 knockout clonal TU8988T lines in base media, positive control GlcNAc, or wildtype TU8988T, HPAC, or MiaPaCa2 CM subject to F/T and diluted 3:1 (75%) (n = 3). (H) GlcNAc dose response curve presented as relative colony number for parental and GFAT1 knockout TU8988T cells (n = 3). (I) Mean of absolute quantitation of GlcNAc in various CM by liquid chromatography-coupled tandem mass spectrometry (LC-MS/MS) (n = 3). Error bars represent mean ± SD. *p < 0.05; **p < 0.01; ***p < 0.001; ****p < 0.0001.


