. 2021 Dec 20;10:e75583. doi: 10.7554/eLife.75583

Figure 1. Cellular localization and activity of FoSir5 in Fusarium oxysporum.

Figure 1.

(A) Sirtuin proteins in F. oxysporum with predicted subcellular localizations. a Accession number of the full-length protein sequence available at Ensembl. bLocalization of the F. oxysporum Sir2 protein determined by WoLF PSORT. (B) Phylogenetic tree relating FoSir5 to the orthologous human Sirtuin isoforms SIRT1 (NP_036370), SIRT2 (NP_085096), SIRT3 (NP_001357239), SIRT4 (NP_036372), SIRT5 (NP_001363737), SIRT6 (NP_057623), and SIRT7 (NP_057622). The tree is based on neighbor-joining analysis using MEGA-X. (C) Fluorescence microscopy analysis of FoSir5-GFP localization with MitoTracker Red (MT) and DAPI. Scale bars = 10 µm. (D) Subcellular fractionation of FoSir5-GFP transformants in F. oxysporum. Nuclear, cytoplasmic, and mitochondrial proteins were separately extracted and FoSir5-GFP were detected with anti-GFP antibody (Materials and methods). The fractionation controls were ATP5A1 (mitochondria), tubulin (cytosol), and histone H3 (nucleus). C, cytosol; N, nucleus; Mito, mitochondria. (E) In vitro Kcr assays with 50 µg of native calf thymus histone (CTH), 5 mM NAD+, and 0.5 µg of FoSir5-His in the presence of 50, 100, or 200 µM crotonyl-CoA. Reaction materials were analyzed by Western blotting with anti-Kcr or anti-H3 antibody. Each scale bar represents the mean ± SD for triplicate experiments. * indicates a significant difference between different pairs of samples (p < 0.05). (F) Expression profile of FoSir5 in conidia, mycelium, and during the germination process. The expression levels were normalized to that of the F. oxysporum elongation factor one alpha (EF-1α) gene. The presence of different letters above the mean values of three replicates indicates a significant difference between different samples (p < 0.05, ANOVA).

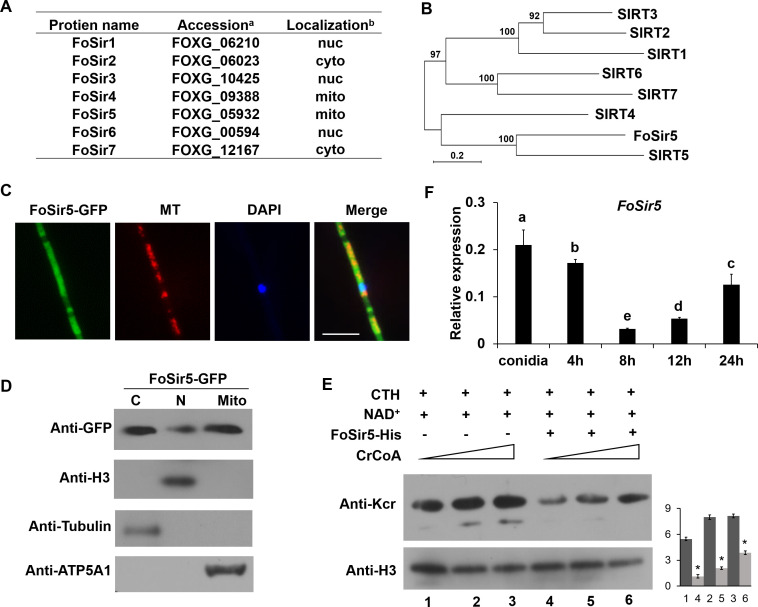
Figure 1—source data 1. Cellular localization and activity of FoSir5 in Fusarium oxysporum.
(A) Sirtuin proteins in F. oxysporum with predicted subcellular localizations. aAccession number of the full-length protein sequence available at Ensembl. bLocalization of the F. oxysporum Sir2 protein determined by WoLF PSORT. (B) Phylogenetic tree relating FoSir5 to the orthologous human Sirtuin isoforms SIRT1 (NP_036370), SIRT2 (NP_085096), SIRT3 (NP_001357239), SIRT4 (NP_036372), SIRT5 (NP_001363737), SIRT6 (NP_057623), and SIRT7 (NP_057622). The tree is based on neighbor-joining analysis using MEGA-X. (C) Fluorescence microscopy analysis of FoSir5-GFP localization with MitoTracker Red (MT) and DAPI. Scale bars = 10 µm. (D) Subcellular fractionation of FoSir5-GFP transformants in F. oxysporum. Nuclear, cytoplasmic, and mitochondrial proteins were separately extracted and FoSir5-GFP were detected with anti-GFP antibody (Materials and methods). The fractionation controls were ATP5A1 (mitochondria), tubulin (cytosol), and histone H3 (nucleus). C, cytosol; N, nucleus; Mito, mitochondria. (E) In vitro Kcr assays with 50 µg of native calf thymus histone (CTH), 5 mM NAD+, and 0.5 µg of FoSir5-His in the presence of 50, 100, or 200 µM crotonyl-CoA. Reaction materials were analyzed by Western blotting with anti-Kcr or anti-H3 antibody. Each scale bar represents the mean ± SD for triplicate experiments. * indicates a significant difference between different pairs of samples (p < 0.05). (F) Expression profile of FoSir5 in conidia, mycelium, and during the germination process. The expression levels were normalized to that of the F. oxysporum elongation factor one alpha (EF-1α) gene. The presence of different letters above the mean values of three replicates indicates a significant difference between different samples (p < 0.05, ANOVA). (The red arrow indicates the original SDS–PAGE gels that were cropped for this panel.)