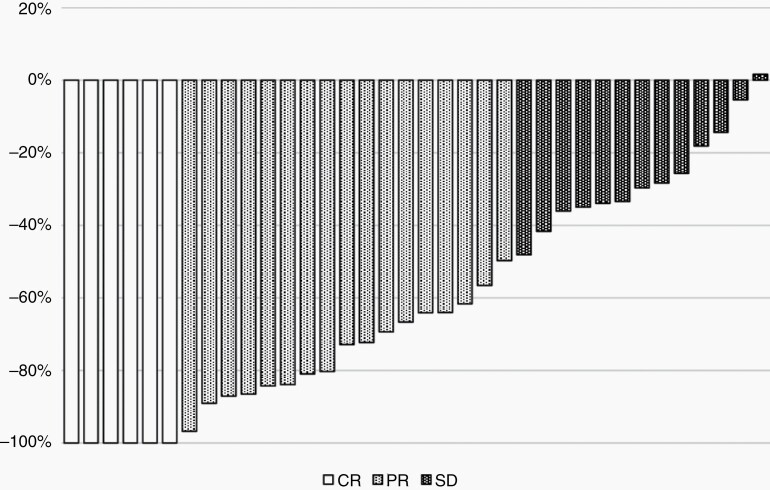
Fig. 1.
Tumor shrinkage analysis using a waterfall plot. The best response was assessed from the baseline image and using the Macdonald criteria. Of the 36 cases, 25 showed tumor shrinkage. Six cases (16.7%) achieved a CR, 17 (47.2%) showed a PR, and 13 (36.1%) had SD. Abbreviations: CR = complete response; PR = partial response; SD = stable disease.

